ModelSkill requires data in Observation and ModelResult objects. These objects are inputs for ModelSkill’s Comparer, which matches data and assesses skill. This section covers PointObservation and PointModelResult for comparing time series at specific points.
Observations
A PointObservation represents measured data, often a time series from one sensor. Each object handles one point and variable. For API details, see the PointObservation documentation.
Key parameters for PointObservation:
Parameter
Description
name
A unique identifier (e.g., “Gauge_A_WaterLevel”). Useful for distinguishing observations and labeling plots.
data
The data source: a dfs0 file path, MIKE IO Dataset, or Pandas DataFrame.
item
Specifies the data column (for Pandas DataFrame) or item (for MIKE IO Dataset or dfs0 path) from the source. Refer by name (string) or numerical index.
quantity
A modelskill.Quantity defining the variable name (e.g., “Water Level”) and unit (e.g., “m”). Essential if the data source (e.g., Pandas DataFrame) lacks this metadata. ModelSkill often infers this from dfs0 files with EUM information.
Understanding the Quantity object in ModelSkill
The quantity parameter (ms.Quantity(name="...", unit="...")) is vital for ModelSkill. It defines the data’s variable (e.g., “Water Level,” “Discharge”) and unit (e.g., “m,” “m^3/s”). This information is used for:
Clear plot labeling.
Compatibility checks between observations and model results.
ModelSkill often infers quantity from dfs0 files with EUM information. For other sources like Pandas DataFrames or CSV files, you must define quantity explicitly.
ModelSkill examples often include x and y coordinates for PointObservation objects. ModelSkill uses these coordinates mainly to interpolate data from spatial model outputs (e.g., dfsu, dfs2 files) to the observation point. This is useful for comparing point observations to 2D or 3D model fields.
This module focuses on comparing time series already extracted for specific points (e.g., from a res1d node to dfs0, or a point sensor dfs0). Thus, we won’t use the x and y spatial interpolation capability extensively here.
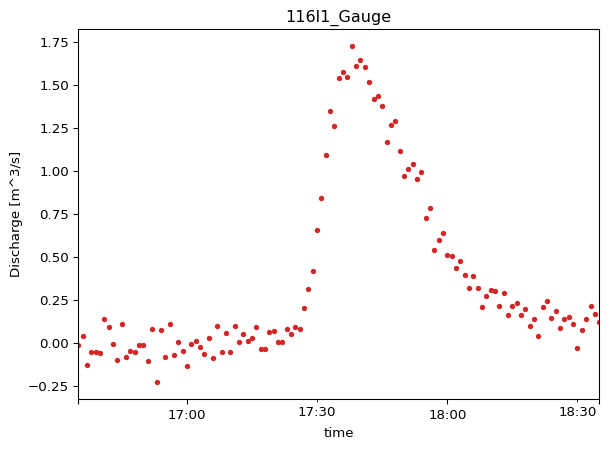
Create a PointObservation from this Dataset, selecting one item.
import modelskill as msobs_116l1 = ms.PointObservation( data=ds_obs, item="116l1_observed", # Selects one column/item name="116l1_Gauge", # Descriptive name for this specific observation)obs_116l1
Ensure DataFrames have a DatetimeIndex, as mentioned in previous modules.
Model Results
PointModelResult objects represent model simulation outputs. Each PointModelResult handles one variable from a specific model output point and represents a model simulation run. See the PointModelResult documentation for API details.
Key parameters for PointModelResult are similar to PointObservation:
Parameter
Description
name
Identifies the model simulation run (e.g., “MIKE_Plus_Scenario_A”).
data
The data source: a dfs0 file path, MIKE IO Dataset, or Pandas DataFrame.
item
Specifies the data column (for Pandas DataFrame) or item (for MIKE IO Dataset or dfs0 path) from the source.
quantity
A modelskill.Quantity. Crucial if metadata is missing (e.g., Pandas DataFrame). Often inferred from dfs0 files with EUM info.
Many PointModelResult objects can share the same name
The name parameter in PointModelResult identifies the overall model simulation, not a specific point. You may create several PointModelResult objects that all come from the same simulation but represent different output locations (e.g., water level at point A, discharge at point B). All these objects should share the same name (e.g., “Model_Run_Alpha”). This shared name signifies they originate from the same model execution. Later, when using ModelSkill’s Comparer, you will explicitly match each of these individual PointModelResult objects to its corresponding Observation object.
From Dataset
First, read a dfs0 file with model output into a MIKE IO Dataset.
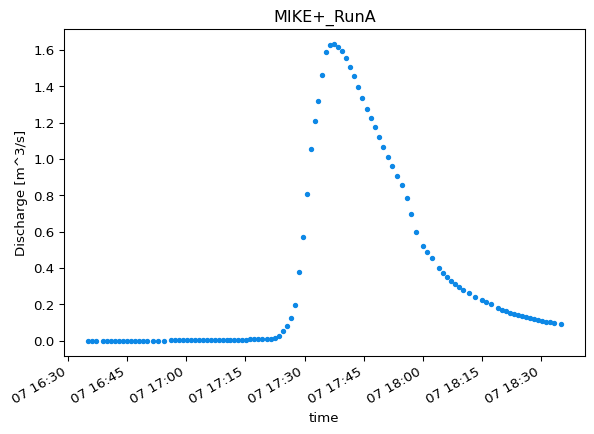
Create the PointModelResult from the Dataset. name identifies the model simulation. quantity is often inferred from dfs0 files with EUM information.
mod_116l1_dataset = ms.PointModelResult( data=ds_model_data, item="reach:Discharge:116l1:37.651", # Item name from the dfs0 name="MIKE+_RunA", # Model simulation identifier)mod_116l1_dataset
Like with observations, the PointModelResult object has useful attributes and methods. For example, plot to verify:
mod_116l1_dataset.plot()
From dfs0 file
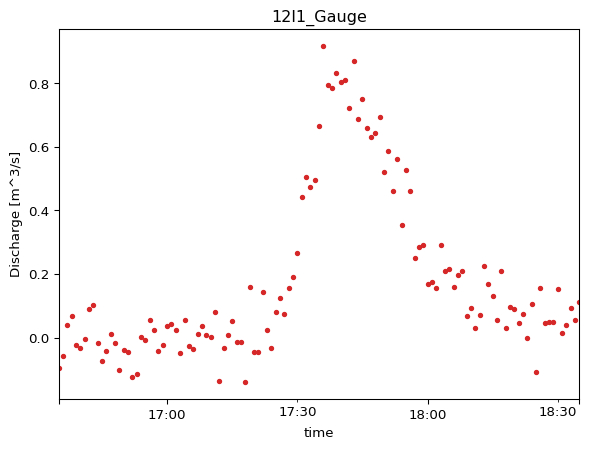
Create a PointModelResult using the dfs0 file path directly.
mod_12l1_file = ms.PointModelResult( data="data/model_results.dfs0", item="reach:Discharge:12l1:28.410", name="MIKE+_RunA", # Same simulation as above, different location/item)mod_12l1_file.to_dataframe().head()
MIKE+_RunA
time
1994-08-07 16:35:00.000
0.000000
1994-08-07 16:36:01.870
-0.000004
1994-08-07 16:37:07.560
-0.000009
1994-08-07 16:38:55.828
-0.000004
1994-08-07 16:39:55.828
0.000006
From Pandas DataFrame
First, prepare a Pandas DataFrame with model data. This example reads a dfs0 file into a DataFrame.
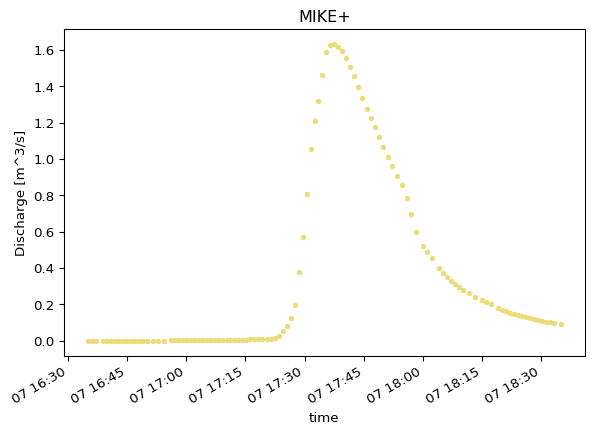
Create a PointModelResult from the DataFrame. Provide quantity as DataFrames lack EUM information.
mod_116l1_df = ms.PointModelResult( data=df_model, item="reach:Discharge:116l1:37.651", # Column name in the DataFrame name="MIKE+_RunA", # Identifies the overall model simulation quantity=ms.Quantity(name="Discharge", unit="m^3/s"),)mod_116l1_df.plot()
From res1d file
MIKE+ res1d files store results for an entire network. For point comparisons with PointObservation in ModelSkill, first extract the specific time series for the point(s) into an intermediate format (e.g., dfs0 file, Pandas DataFrame). This example extracts one model output point to a dfs0 file, then creates a PointModelResult.
First, extract model output (one point, one variable) to a dfs0 file.
res = mikeio1d.open("data/network.res1d")res.reaches["116l1"]["37.651"].Discharge.to_dfs0("data/model_Q_116l1.dfs0")ds = mikeio.read("data/model_Q_116l1.dfs0")ds
Future: better integration of res1d with ModelSkill
Future versions of ModelSkill may allow creating a network result, instead of a point result. This would allow network results to automatically be matched with corresponding observations, eliminating the need to manually match individual model result points with observation points.
Best Practices
Consistent data organization and naming are key.
Organize Data: Structure observation and model result files (e.g., separate folders, clear names). This helps when programmatically accessing many files.
Descriptive Names: Use name in PointObservation and PointModelResult for clear identifiers (e.g., PointObservation(name="Flow_Gauge_West")). This aids in managing objects, improves plot clarity, and helps programmatic creation with many observations or runs.
Specify Units and Quantities: Always provide quantity for sources like DataFrames or CSVs. ModelSkill often infers this from dfs0 files with EUM information. Correct metadata is crucial for comparisons, visualizations, and automated workflows. See the modelskill.Quantity callout and official documentation.
Beyond points: Exploring other data types in ModelSkill
ModelSkill is versatile. This section focuses on point data, but the package also supports TrackObservation (data along a path) and GridObservation (gridded data). These are useful for different validation scenarios. See the official documentation for examples and use cases.