sk_single = comparer_116l1.skill()
sk_single| n | bias | rmse | urmse | mae | cc | si | r2 | |
|---|---|---|---|---|---|---|---|---|
| observation | ||||||||
| 116l1 | 121 | 0.003229 | 0.068114 | 0.068037 | 0.054517 | 0.991234 | 0.172594 | 0.982405 |
Visualizing model performance provides qualitative insights, but quantitative metrics are essential for objective assessment and comparison. Skill scores serve this purpose by providing numerical measures of how well a model’s predictions match observed data. ModelSkill facilitates the calculation of these key statistics through its Comparer and ComparerCollection objects.
The Comparer object (e.g., comparer_116l1) calculates skill scores for a single observation-model pair.
The skill() method returns a SkillTable object, which is a specialized data structure provided by ModelSkill for presenting multiple skill scores in a clear, tabular format.
sk_single = comparer_116l1.skill()
sk_single| n | bias | rmse | urmse | mae | cc | si | r2 | |
|---|---|---|---|---|---|---|---|---|
| observation | ||||||||
| 116l1 | 121 | 0.003229 | 0.068114 | 0.068037 | 0.054517 | 0.991234 | 0.172594 | 0.982405 |
You’ll notice several metrics listed (e.g., bias, rmse, nse). We’ll cover the definitions of common metrics in more detail at the end of this section.
The SkillTable object can be converted to a Pandas DataFrame using sk_single.to_dataframe().
To get a subset of metrics, pass a list of metric names to the metrics argument.
sk_subset_single = comparer_116l1.skill(metrics=['rmse', 'bias', 'nse'])
sk_subset_single| n | rmse | bias | nse | |
|---|---|---|---|---|
| observation | ||||
| 116l1 | 121 | 0.068114 | 0.003229 | 0.982405 |
Use score() for direct access to a single numerical value for a specific metric. If model results within the Comparer are named (as in this example with “MIKE+”), this method returns a dictionary where keys are model names.
rmse_val_dict = comparer_116l1.score(metric='rmse')
print(f"RMSE for MIKE+ at 116l1: {rmse_val_dict['MIKE+']:.4f}")

bias_val_dict = comparer_116l1.score(metric='bias')
print(f"Bias for MIKE+ at 116l1: {bias_val_dict['MIKE+']:.4f}")
RMSE for MIKE+ at 116l1: 0.0681
Bias for MIKE+ at 116l1: 0.0032The ComparerCollection (e.g., cc) assesses model performance across multiple observation points.
Calling skill() on a ComparerCollection returns a SkillTable object summarizing skill for each Comparer within the collection.
sk_coll = cc.skill()
sk_coll| n | bias | rmse | urmse | mae | cc | si | r2 | |
|---|---|---|---|---|---|---|---|---|
| observation | ||||||||
| 116l1 | 121 | 0.003229 | 0.068114 | 0.068037 | 0.054517 | 0.991234 | 0.172594 | 0.982405 |
| 12l1 | 121 | -0.004083 | 0.063414 | 0.063282 | 0.049679 | 0.971574 | 0.305942 | 0.942928 |
You can request specific metrics for all comparisons.
sk_subset_coll = cc.skill(metrics=['rmse', 'bias'])
sk_subset_coll| n | rmse | bias | |
|---|---|---|---|
| observation | |||
| 116l1 | 121 | 0.068114 | 0.003229 |
| 12l1 | 121 | 0.063414 | -0.004083 |
The mean_skill() method calculates average skill scores across all locations, presented in a SkillTable.
sk_mean = cc.mean_skill()
sk_mean| n | bias | rmse | urmse | mae | cc | si | r2 | |
|---|---|---|---|---|---|---|---|---|
| model | ||||||||
| MIKE+ | 242 | -0.000427 | 0.065764 | 0.06566 | 0.052098 | 0.981404 | 0.239268 | 0.962667 |
And for specific metrics:
sk_mean_subset = cc.mean_skill(metrics=['rmse', 'bias', 'nse'])
sk_mean_subset| n | rmse | bias | nse | |
|---|---|---|---|---|
| model | ||||
| MIKE+ | 242 | 0.065764 | -0.000427 | 0.962667 |
The mean_skill() method allows for weighted averages. You can provide weights for each observation if, for example, you trust some observation points more than others or if they represent areas of different importance. See the ModelSkill documentation for details on applying weights.
The score() method on a ComparerCollection calculates a score for each model across all relevant observations. It returns a Python dictionary where keys are the model names (e.g., ‘MIKE+’) and values are these scores (e.g., mean RMSE for ‘MIKE+’). This provides a single summary value for each model’s performance on a specific metric.
# For our ComparerCollection 'cc' containing one model named "MIKE+"
score_rmse_scores = cc.score(metric='rmse')
print(f"Mean RMSE for models: {score_rmse_scores}")

score_bias_scores = cc.score(metric='bias')
print(f"Mean Bias for models: {score_bias_scores}")
Mean RMSE for models: {'MIKE+': 0.06576367286619714}
Mean Bias for models: {'MIKE+': -0.00042693940822553073}Similar to mean_skill(), the score() method on a ComparerCollection also supports weighting. This enables you to calculate a weighted mean score (e.g., weighted RMSE) for each model across all observations.
SkillTable objects are more than just static tables; they offer several useful features for analysis and presentation.
You can sort the SkillTable by any of its columns (metrics or identifiers). This is useful for ranking models or observations.
# Sort by RMSE in ascending order
sk_coll_sorted = sk_coll.sort_values('rmse', ascending=True)
sk_coll_sorted| n | bias | rmse | urmse | mae | cc | si | r2 | |
|---|---|---|---|---|---|---|---|---|
| observation | ||||||||
| 12l1 | 121 | -0.004083 | 0.063414 | 0.063282 | 0.049679 | 0.971574 | 0.305942 | 0.942928 |
| 116l1 | 121 | 0.003229 | 0.068114 | 0.068037 | 0.054517 | 0.991234 | 0.172594 | 0.982405 |
SkillTable objects integrate with Pandas’ styling capabilities, allowing you to highlight important values, apply color maps, or format numbers for better readability in Jupyter environments.
sk_coll.style()| n | bias | rmse | urmse | mae | cc | si | r2 | |
|---|---|---|---|---|---|---|---|---|
| observation | ||||||||
| 116l1 | 121 | 0.003 | 0.068 | 0.068 | 0.055 | 0.991 | 0.173 | 0.982 |
| 12l1 | 121 | -0.004 | 0.063 | 0.063 | 0.050 | 0.972 | 0.306 | 0.943 |
SkillTable objects have a .plot accessor for quickly visualizing skill scores, such as creating bar charts of metrics.
# Bar plot of RMSE for each observation point
sk_coll["rmse"].plot.bar()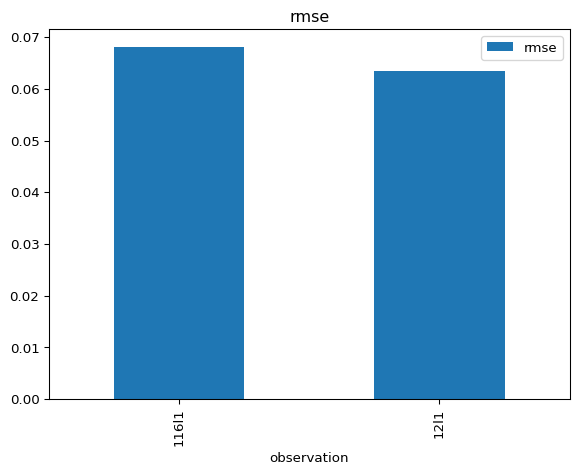
These are just a few examples. The SkillTable’s .style and .plot accessors offer more customization. Refer to the ModelSkill documentation and Pandas styling documentation for further details.
ModelSkill calculates numerous metrics. The choice of metrics depends on your modelling goals. Some useful metrics include:
bias): Average difference (Modeled - Observed). Ideal: 0.rmse): Typical magnitude of error. Ideal: 0.nse): Measures the predictive power of the model compared to using the mean of the observed data as the prediction. Ranges from -\(\infty\) to 1. Ideal: 1.kge): A composite metric evaluating correlation, bias, and variability components. Ranges from -\(\infty\) to 1. Ideal: 1.willmott): Measures the degree of model prediction error, standardized by observed variability. Ranges from 0 to 1. Ideal: 1.pr): Ratio of the maximum modeled value to the maximum observed value over the matched time period. Ideal: 1.0.You can change the default list of metrics that are used by skill() and mean_skill() as follows:
ms.set_option("metrics.list", ['bias', 'rmse', 'nse', 'kge', 'willmott', 'pr'])
cc.skill()| n | bias | rmse | nse | kge | willmott | pr | |
|---|---|---|---|---|---|---|---|
| observation | |||||||
| 116l1 | 121 | 0.003229 | 0.068114 | 0.982405 | 0.977502 | 0.995498 | 0.944704 |
| 12l1 | 121 | -0.004083 | 0.063414 | 0.942928 | 0.932798 | 0.984693 | 0.891797 |
Reset to default values with ms.reset_option("metrics.list").
For a comprehensive list of all available metrics and their precise definitions, please refer to the official ModelSkill API documentation for metrics.
ModelSkill’s metrics are extensible. You can define and use your own custom skill score functions if needed. If you believe a metric would be broadly useful, consider suggesting it for inclusion in ModelSkill via a GitHub issue.