import numpy as np8 Scientific Python
Python is a general purpose programming language that’s used by a broad range of domains. MIKE+ modelling workflows most closely align with the scientific python community.
8.1 Package ecosystem for scientific Python
There are several useful packages for engineering and science. This course will use the following packages:
Check out packages sponsored by NumFOCUS for an overview of useful libraries.
Tip
DHI builds their Python ecosystem on top of these packages, to enable better integration between them and allow scientists/engineers the flexibility that’s often required.
8.2 NumPy
NumPy is a package that essentially enables faster numerical computing on large arrays than would otherwise be possible via Python collections. It is foundational to many other packages.
NumPy is imported as np by convention:
Note
Import as ‘np’ simply imports numpy and creates an alias for it as ‘np’.
Create a NumPy array from a Python collection:
my_array = np.array([1, 2, 3])
my_array
array([1, 2, 3])Use vectorized operations on arrays. For example, multiply all elements of the previous array by 2:
my_array * 2array([2, 4, 6])Index and slice arrays the same way as Python collections:
my_array[0]np.int64(1)Perform aggregation functions on an array (e.g. sum, mean, max):
my_array.sum()np.int64(6)Refer to NumPy’s official documentation for additional information.
8.3 Pandas
Pandas builds upon NumPy with a special focus on tabular data (like spreadsheets, or csv files).
Pandas is imported as ‘pd’ by convention:
import pandas as pdCreate a DataFrame, which is like a 2D labeled array (rows + columns):
import pandas as pd
data = [['Alice', 25], ['Bob', 30]]
df = pd.DataFrame(data, columns=['name', 'age'])
df| name | age | |
|---|---|---|
| 0 | Alice | 25 |
| 1 | Bob | 30 |
Select a single column by name:
df['age']0 25
1 30
Name: age, dtype: int64Perform aggregation operations just like as with NumPy:
df['age'].mean()np.float64(27.5)Import data from a csv file into a pandas DataFrame:
rainfall = pd.read_csv('data/fake_daily_rainfall.csv', index_col='date')
rainfall.head()| rainfall_mm | |
|---|---|
| date | |
| 2025-06-01 | 17.450712 |
| 2025-06-02 | 7.926035 |
| 2025-06-03 | 19.715328 |
| 2025-06-04 | 32.845448 |
| 2025-06-05 | 6.487699 |
Note
Use the head method of a DataFrame to view the first five rows of very long DataFrames.
Create plots from a DataFrame:
rainfall.plot(kind='bar')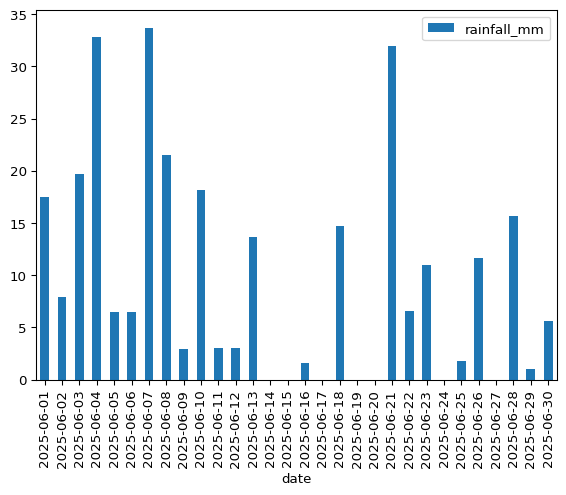
Export a DataFrame to csv, excel, or other formats:
rainfall.to_csv("temp.csv")
rainfall.to_excel("temp.xlsx")
Refer to pandas’s official documentation for additional information.
8.4 Matplotlib
Matplotlib is a library for creating plots and is commonly used by other libraries.
Matplotlib is imported as ‘plt’ by convention:
import matplotlib.pyplot as pltCreate a simple line plot:
# Create some data
x = np.array([1, 2, 3, 4, 5])
y = x ** 2

# Make the plot
plt.plot(x, y)              # Plots x vs y
plt.title("My plot")        # Gives a title to the plot
plt.xlabel("X Axis")        # Labels the x-axis
plt.ylabel("Y Axis")        # Labels the y-axis
plt.grid()                  # Turns on grid lines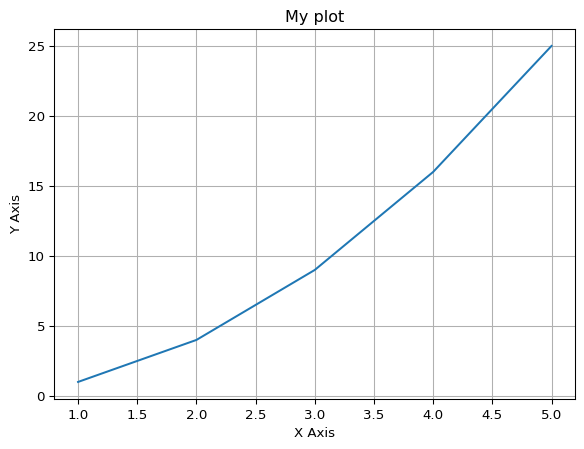
Refer to Matplotlib’s official documentation for additional information.
Also, feel free to check out their example gallery for a sense of what’s possible.