In this tutorial you set up a Python project, read results from a MIKE 21 flow model of the Øresund, plot them, and save the maximum water level to a new dfsu file.
MIKE IO runs on Windows and Linux, with 64-bit Python 3.12 to 3.15. On Windows it needs the VC++ redistributables , which are already installed if you have MIKE.
Set up a project
Install uv . uv installs Python for you, so you don’t need a Python installation first.
Create a project folder with MIKE IO and JupyterLab in it:
uv init mikeio-tutorialcd mikeio-tutorialuv add mikeio jupyterlabDownload oresundHD_run1.dfsu into the mikeio-tutorial folder, then start JupyterLab:
Create a new notebook and type the code below into its cells.
Read the file
import mikeio= mikeio.read("oresundHD_run1.dfsu" )
<mikeio.Dataset>
title: hot
dims: (time:5, element:3612)
time: 2018-03-07 00:00:00 - 2018-03-11 00:00:00 (5 records)
geometry: Dfsu2D (3612 elements, 2046 nodes)
items:
  0:  Surface elevation <Surface Elevation> (meter)
  1:  Total water depth <Water Depth> (meter)
  2:  U velocity <u velocity component> (meter per sec)
  3:  V velocity <v velocity component> (meter per sec)
ds is a Dataset . The summary shows that the file holds four items on a mesh of 3612 elements, with one value per day from 7 to 11 March 2018.
Pick out one item
= ds["Surface elevation" ]
<mikeio.DataArray>
name: Surface elevation
dims: (time:5, element:3612)
time: 2018-03-07 00:00:00 - 2018-03-11 00:00:00 (5 records)
geometry: Dfsu2D (3612 elements, 2046 nodes)
da is a DataArray : the values of one item, together with its time axis and mesh.
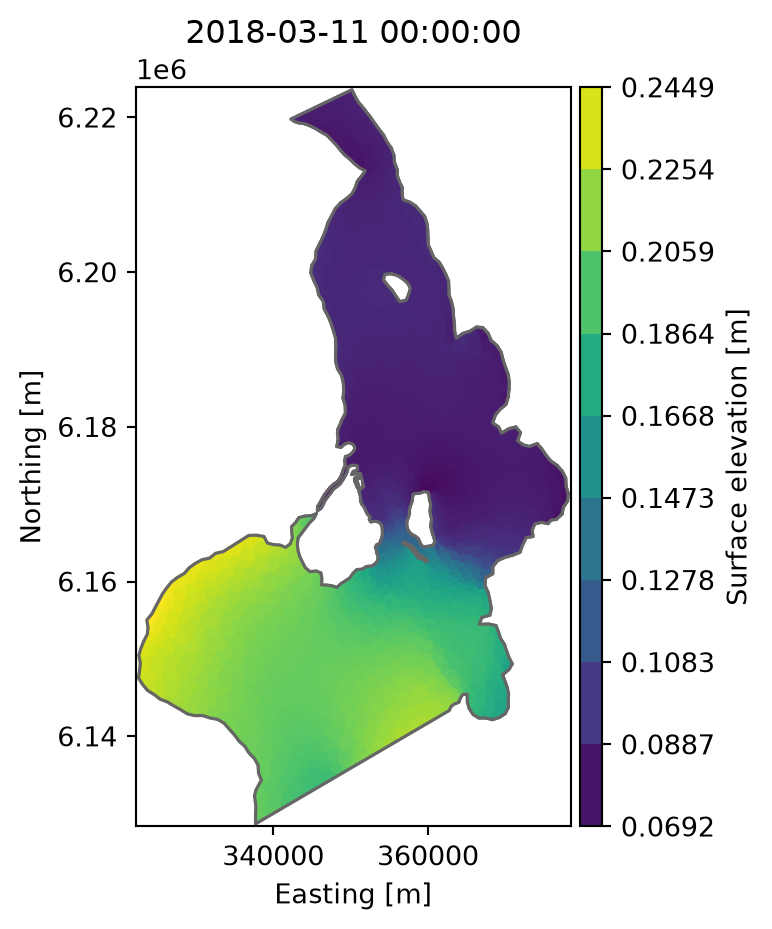
Plot the surface elevation on the last day:
= "2018-03-11" ).plot();
Look at one location
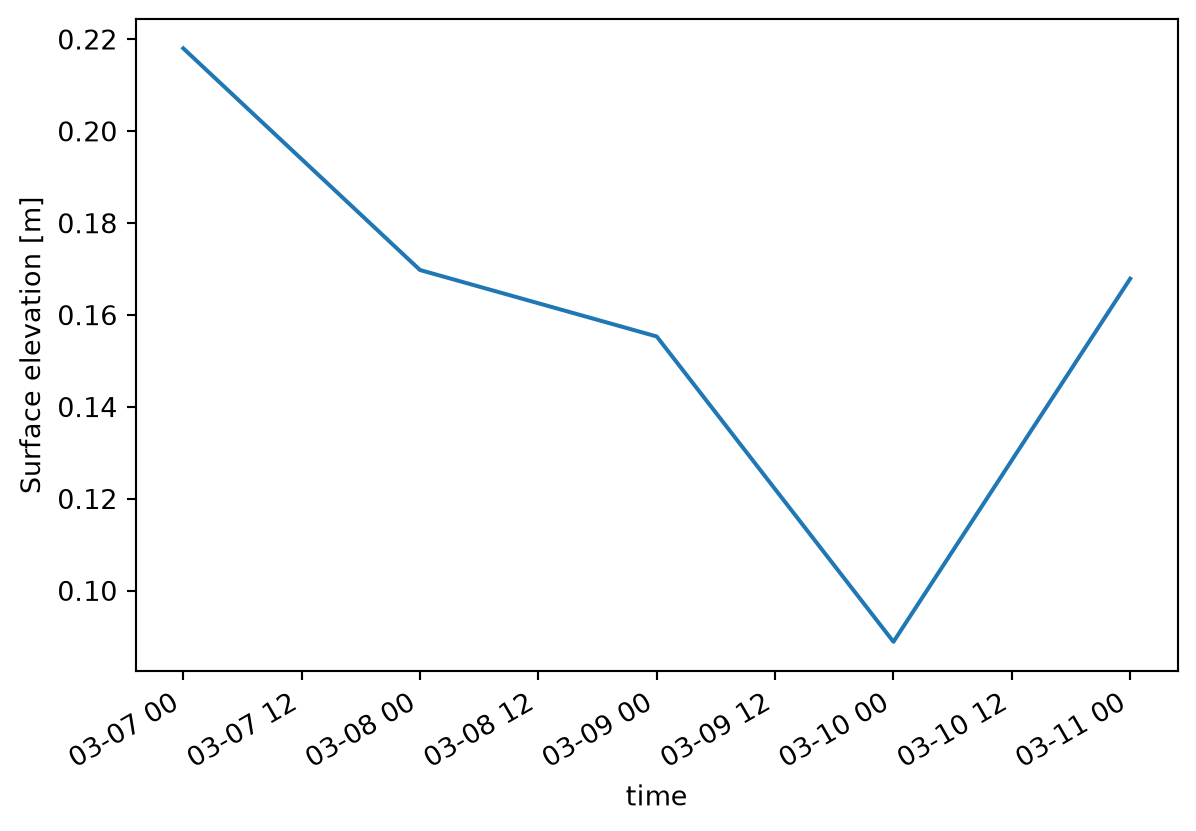
Select the element that contains a point, given in the coordinates of the mesh (UTM zone 33):
= da.sel(x= 355000 , y= 6160000 )
<mikeio.DataArray>
name: Surface elevation
dims: (time:5)
time: 2018-03-07 00:00:00 - 2018-03-11 00:00:00 (5 records)
geometry: GeometryPoint2D(x=354816.6976450601, y=6160117.965661476)
values: [0.218, 0.1698, ..., 0.1679]
The result is a time series. Plot it:
Save the maximum water level
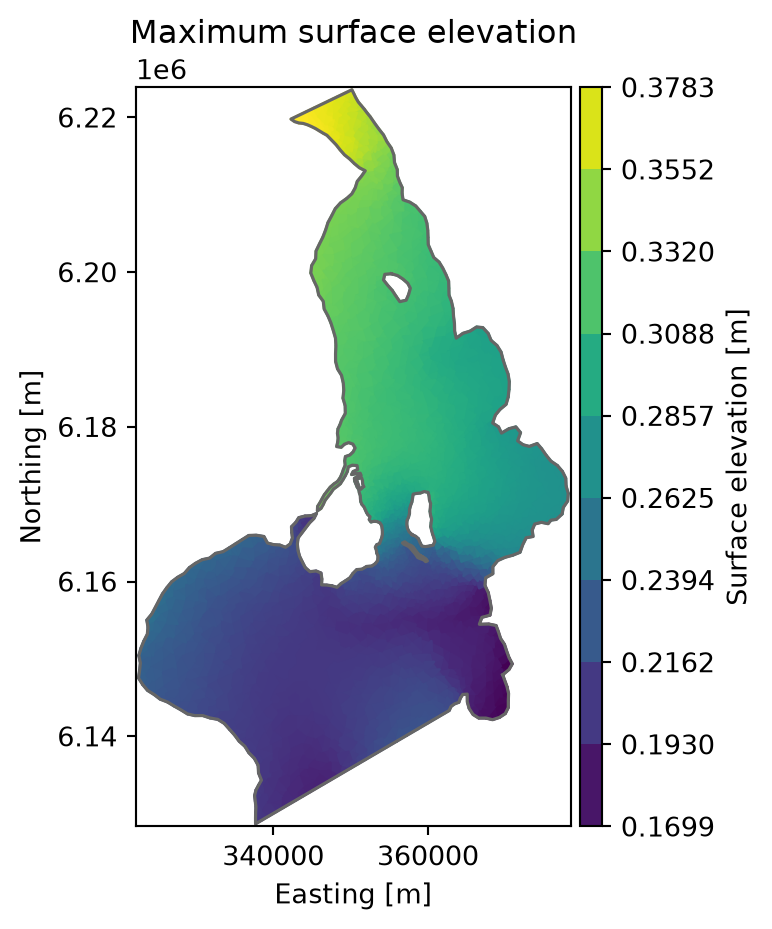
Take the maximum over time in each element:
= da.max (axis= "time" )= "Maximum surface elevation" );
Write it to a new dfsu file:
"max_elevation.dfsu" )
Read it back to check the result:
"max_elevation.dfsu" )
<mikeio.Dataset>
dims: (time:1, element:3612)
time: 2018-03-07 00:00:00 (time-invariant)
geometry: Dfsu2D (3612 elements, 2046 nodes)
items:
  0:  Surface elevation <Surface Elevation> (meter)
You can open max_elevation.dfsu in MIKE Zero like any other dfsu file.