The DataArray is the common MIKE IO data structure for item data from dfs files. The mikeio.read methods returns a Dataset as a container of DataArrays (Dfs items)
You can modify the values of a DataArray by changing its values:
da.values[0, 3] =5.0
If you wish to change values of a subset of the DataArray you should be aware of the difference between a view and a copy of the data. Similar to NumPy, MIKE IO selection method will return a view of the data when using single index and slices, but a copy of the data using fancy indexing (a list of indicies or boolean indexing). Note that prior to release 1.3, MIKE IO would always return a copy.
It is recommended to change the values using values property directly on the original DataArray (like above), but it is also possible to change the values of the original DataArray by working on a subset DataArray if it is selected with single index or slice as explained above.
da_sub = da.isel(time=0)da_sub.values[:] =5.0# will change da
Fancy indexing will return a copy and therefore not change the original:
da_sub = da.isel(time=[0,1,2])da_sub.values[:] =5.0# will NOT change da
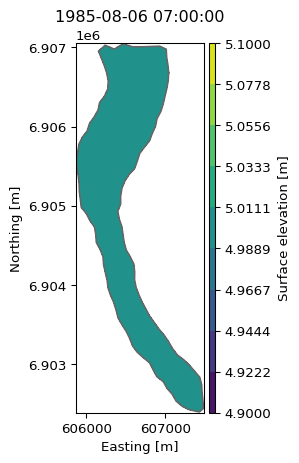
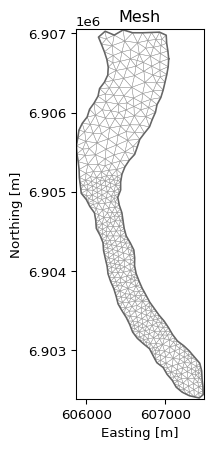
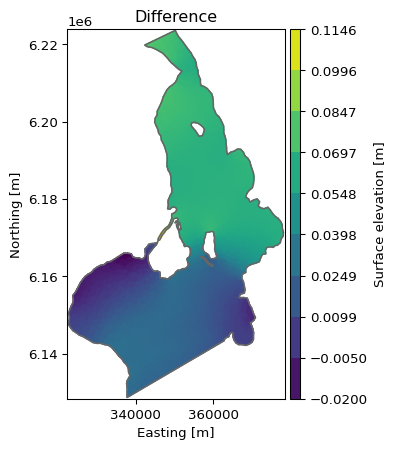
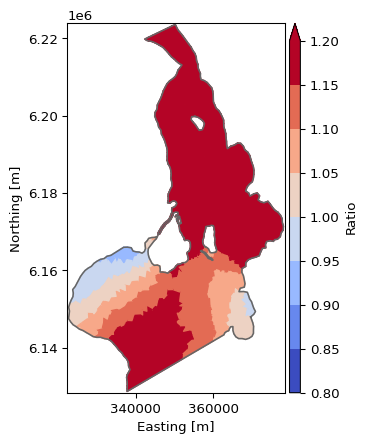
Plotting
The plotting of a DataArray is context-aware meaning that plotting behaviour depends on the geometry of the DataArray being plotted.
Multiplication and divison of two physical quantities would normally change the unit of the result, but in the case of DataArrays, the type and unit of the result will be the ones of the first operand.