The Dataset is the MIKE IO data structure for data from dfs files. The mikeio.readDataArray (Dfs items). Each DataArray has the properties, item , time , geometry and values . The time and geometry are common to all DataArrays in the Dataset.
The Dataset has the following primary properties:
items - a list of mikeio.ItemInfotime - a pandas.DatetimeIndexgeometry - a Geometry object with the spatial description of the data
Use Dataset’s string representation to get an overview of the Dataset
import mikeio= mikeio.read("../data/HD2D.dfsu" )
<mikeio.Dataset>
title: Output 1
dims: (time:9, element:884)
time: 1985-08-06 07:00:00 - 1985-08-07 03:00:00 (9 records)
geometry: Dfsu2D (884 elements, 529 nodes)
items:
  0:  Surface elevation <Surface Elevation> (meter)
  1:  U velocity <u velocity component> (meter per sec)
  2:  V velocity <v velocity component> (meter per sec)
  3:  Current speed <Current Speed> (meter per sec)
Selecting a specific item “itemA” (at position 0) from a Dataset ds can be done with:
ds[["itemA"]] - returns a new Dataset with “itemA”ds["itemA"] - returns “itemA” DataArrayds[[0]] - returns a new Dataset with “itemA”ds[0] - returns “itemA” DataArrayds.itemA - returns “itemA” DataArray
We recommend to use named items for readability.
<mikeio.DataArray>
name: Surface elevation
dims: (time:9, element:884)
time: 1985-08-06 07:00:00 - 1985-08-07 03:00:00 (9 records)
geometry: Dfsu2D (884 elements, 529 nodes)
Negative index e.g. ds[-1] can also be used to select from the end. Several items (“itemA” at 0 and “itemC” at 2) can be selected with the notation:
ds[["itemA", "itemC"]]ds[[0, 2]]
Note that this behavior is similar to pandas and xarray.
A time slice of a Dataset can be selected with sel (by label/value) or isel (by integer index), similar to xarray .
Select a single timestep by value:
= "1985-08-06 12:00" )
<mikeio.Dataset>
title: Output 1
dims: (element:884)
time: 1985-08-06 12:00:00 (time-invariant)
geometry: Dfsu2D (884 elements, 529 nodes)
items:
  0:  Surface elevation <Surface Elevation> (meter)
  1:  U velocity <u velocity component> (meter per sec)
  2:  V velocity <v velocity component> (meter per sec)
  3:  Current speed <Current Speed> (meter per sec)
Select a range of timesteps by value:
= slice ("1985-08-06 12:00" , "1985-08-06 17:00" ))
<mikeio.Dataset>
title: Output 1
dims: (time:3, element:884)
time: 1985-08-06 12:00:00 - 1985-08-06 17:00:00 (3 records)
geometry: Dfsu2D (884 elements, 529 nodes)
items:
  0:  Surface elevation <Surface Elevation> (meter)
  1:  U velocity <u velocity component> (meter per sec)
  2:  V velocity <v velocity component> (meter per sec)
  3:  Current speed <Current Speed> (meter per sec)
Select a single timestep by index:
<mikeio.Dataset>
title: Output 1
dims: (element:884)
time: 1985-08-06 12:00:00 (time-invariant)
geometry: Dfsu2D (884 elements, 529 nodes)
items:
  0:  Surface elevation <Surface Elevation> (meter)
  1:  U velocity <u velocity component> (meter per sec)
  2:  V velocity <v velocity component> (meter per sec)
  3:  Current speed <Current Speed> (meter per sec)
Select every other timestep using a slice:
= slice (None , None , 2 ))
<mikeio.Dataset>
title: Output 1
dims: (time:5, element:884)
time: 1985-08-06 07:00:00 - 1985-08-07 03:00:00 (5 records)
geometry: Dfsu2D (884 elements, 529 nodes)
items:
  0:  Surface elevation <Surface Elevation> (meter)
  1:  U velocity <u velocity component> (meter per sec)
  2:  V velocity <v velocity component> (meter per sec)
  3:  Current speed <Current Speed> (meter per sec)
To extract every n’th timestep directly to a new file without loading all data into memory, use mikeio.generic.extractstep parameter.
The sel method finds a single element.
= 607002 , y= 6906734 )
<mikeio.Dataset>
title: Output 1
dims: (time:9)
time: 1985-08-06 07:00:00 - 1985-08-07 03:00:00 (9 records)
geometry: GeometryPoint2D(x=607002.7094112666, y=6906734.833048992)
items:
  0:  Surface elevation <Surface Elevation> (meter)
  1:  U velocity <u velocity component> (meter per sec)
  2:  V velocity <v velocity component> (meter per sec)
  3:  Current speed <Current Speed> (meter per sec)
In most cases, you will not plot the Dataset, but rather its DataArrays. But there are two exceptions:
dfs0-Dataset : plot all items as timeseries with ds.plot()
scatter : compare two items using ds.plot.scatter(x=“itemA”, y=“itemB”)
See the DatasetPlotter API for details.
Add a new item
A common workflow is to create a new item based on existing items in a dataset.
This can be in done in several ways. Let’s try one of the options.
= mikeio.read("../data/NorthSea_HD_and_windspeed.dfsu" )
<mikeio.Dataset>
title: Area Series
dims: (time:67, element:958)
time: 2017-10-27 00:00:00 - 2017-10-29 18:00:00 (67 records)
geometry: Dfsu2D (958 elements, 570 nodes)
items:
0: Surface elevation <Surface Elevation> (meter)
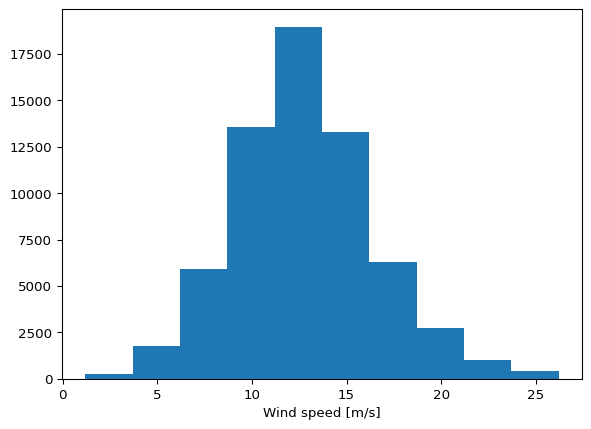
1: Wind speed <Wind speed> (meter per sec)
Create a copy of the DataArray
= ds.Wind_speed.copy();
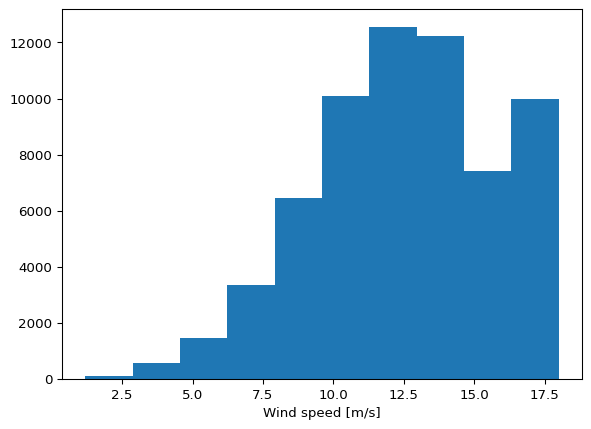
Make the modifications, in this case we will clip the values to the interval 1-18 m/s.
import numpy as np= np.clip(ws2.to_numpy(), 1 ,18 );
Assign it to a new name in the dataset
"Wind_speed_clipped" ] = ws2
<mikeio.Dataset>
title: Area Series
dims: (time:67, element:958)
time: 2017-10-27 00:00:00 - 2017-10-29 18:00:00 (67 records)
geometry: Dfsu2D (958 elements, 570 nodes)
items:
  0:  Surface elevation <Surface Elevation> (meter)
  1:  Wind speed <Wind speed> (meter per sec)
  2:  Wind_speed_clipped <Wind speed> (meter per sec)
Reorder items if necessary (See selecting items above)
= ds[["Wind_speed_clipped" , "Surface elevation" , "Wind speed" ]]
<mikeio.Dataset>
title: Area Series
dims: (time:67, element:958)
time: 2017-10-27 00:00:00 - 2017-10-29 18:00:00 (67 records)
geometry: Dfsu2D (958 elements, 570 nodes)
items:
  0:  Wind_speed_clipped <Wind speed> (meter per sec)
  1:  Surface elevation <Surface Elevation> (meter)
  2:  Wind speed <Wind speed> (meter per sec)
Write the new dataset to a new file
"modified.dfsu" )
Properties
The Dataset (and DataArray) has several properties:
n_items - Number of items
n_timesteps - Number of timesteps
start_time - First time instance (as datetime)
end_time - Last time instance (as datetime)
is_equidistant - Is the time series equidistant in time
timestep - Time step in seconds (if is_equidistant)
shape - Shape of each item
deletevalue - File delete value (NaN value)
Methods
Dataset (and DataArray) has several useful methods for working with data, including different ways of selecting data:
sel()isel()
Aggregations along an axis:
mean()nanmean()max()nanmax()min()nanmin()average()aggregate()quantile()nanquantile()
Other methods that also return a Dataset: