MIKE 21 SW can output the full wave spectrum, not just integrated parameters such as Hm0. Those files are dfsu files with up to two extra axes, frequency and direction, and they come in three shapes:
point — the spectrum at a single position
line — spectra along a line crossing the domain
area — spectra at every element of a mesh
The geometry tells you which one you have, and is_spectral distinguishes these files from ordinary dfsu output.
import numpy as npimport mikeioda = mikeio.read("../data/spectra/pt_spectra.dfsu")[0]da
<mikeio.DataArray>
name: Point 1: Energy density
dims: (time:31, direction:16, frequency:25)
time: 2017-10-27 00:00:00 - 2017-10-27 05:00:00 (31 records)
geometry: Point Spectrum Geometry(frequency:25, direction:16)
da.dims
('time', 'direction', 'frequency')
The frequency and direction axes are on the geometry:
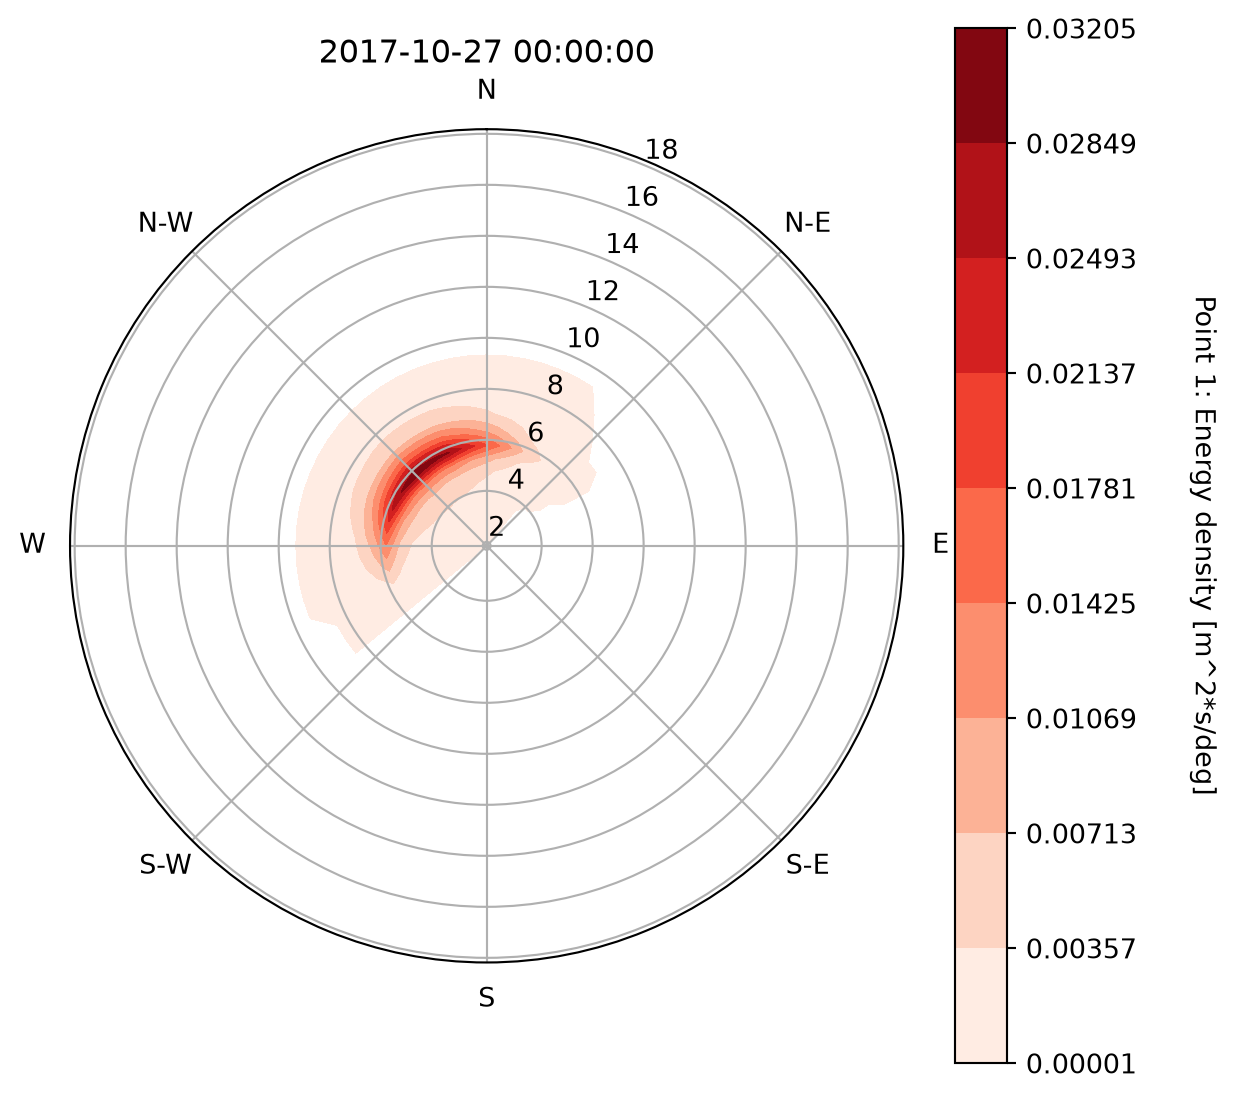
Plotting a point spectrum gives a polar plot of the first time step:
da.plot();
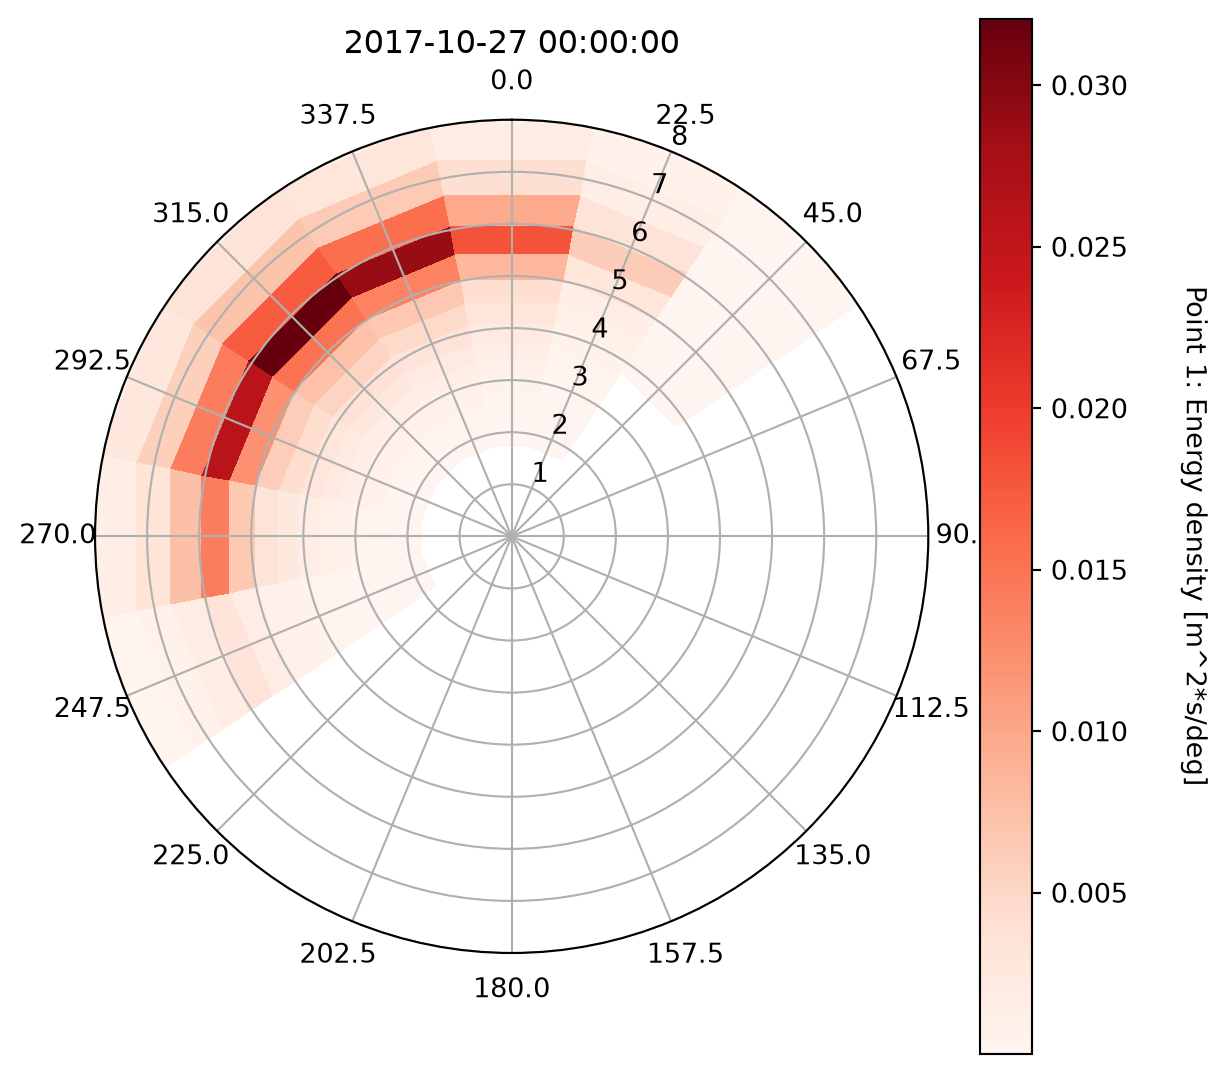
plot.patch takes the same arguments and returns the axes, so the plot can be adjusted — here the radial limit is capped and the spokes labelled with the actual direction values:
r_as_periods=True labels the radial axis with wave periods rather than frequencies.
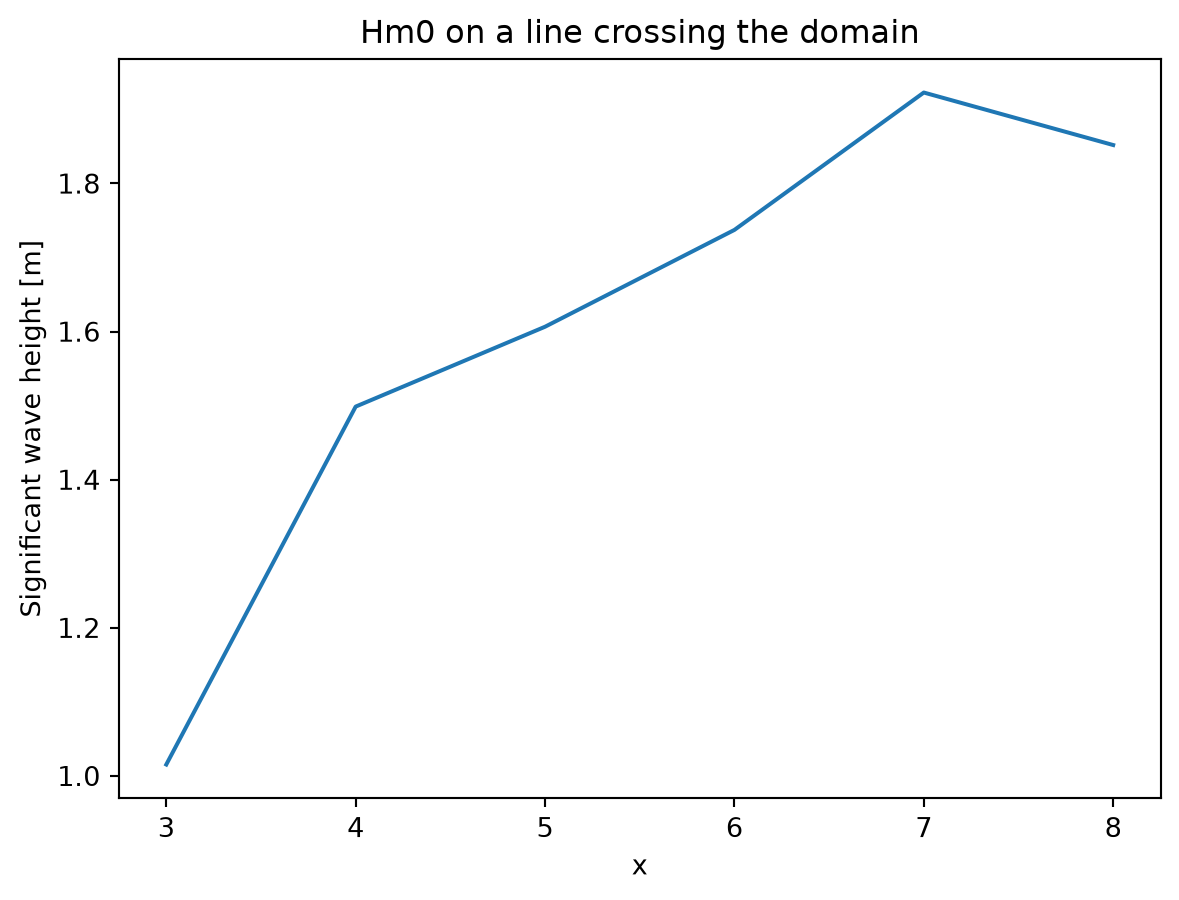
Plotting the whole line, rather than one node, gives the integrated Hm0 along it:
da.plot(title="Hm0 on a line crossing the domain");
Area spectra
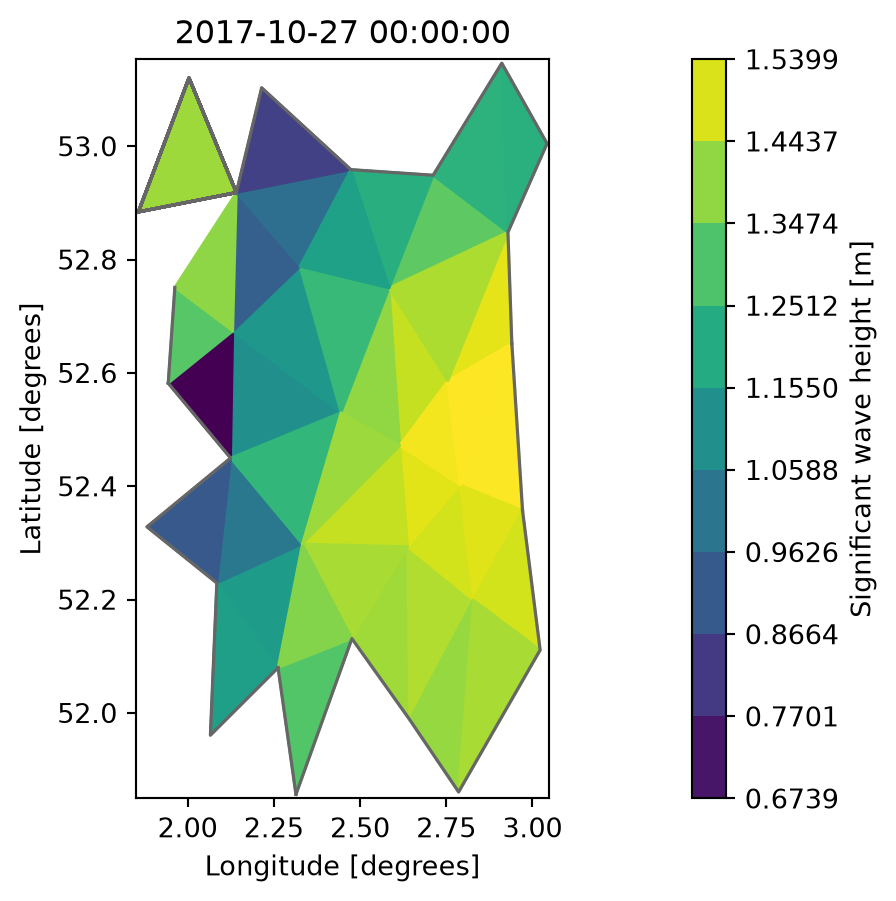
For an area file the default plot is again the integrated Hm0, over the mesh:
da = mikeio.read("../data/spectra/area_spectra.dfsu", items="Energy density")[0]da.plot();
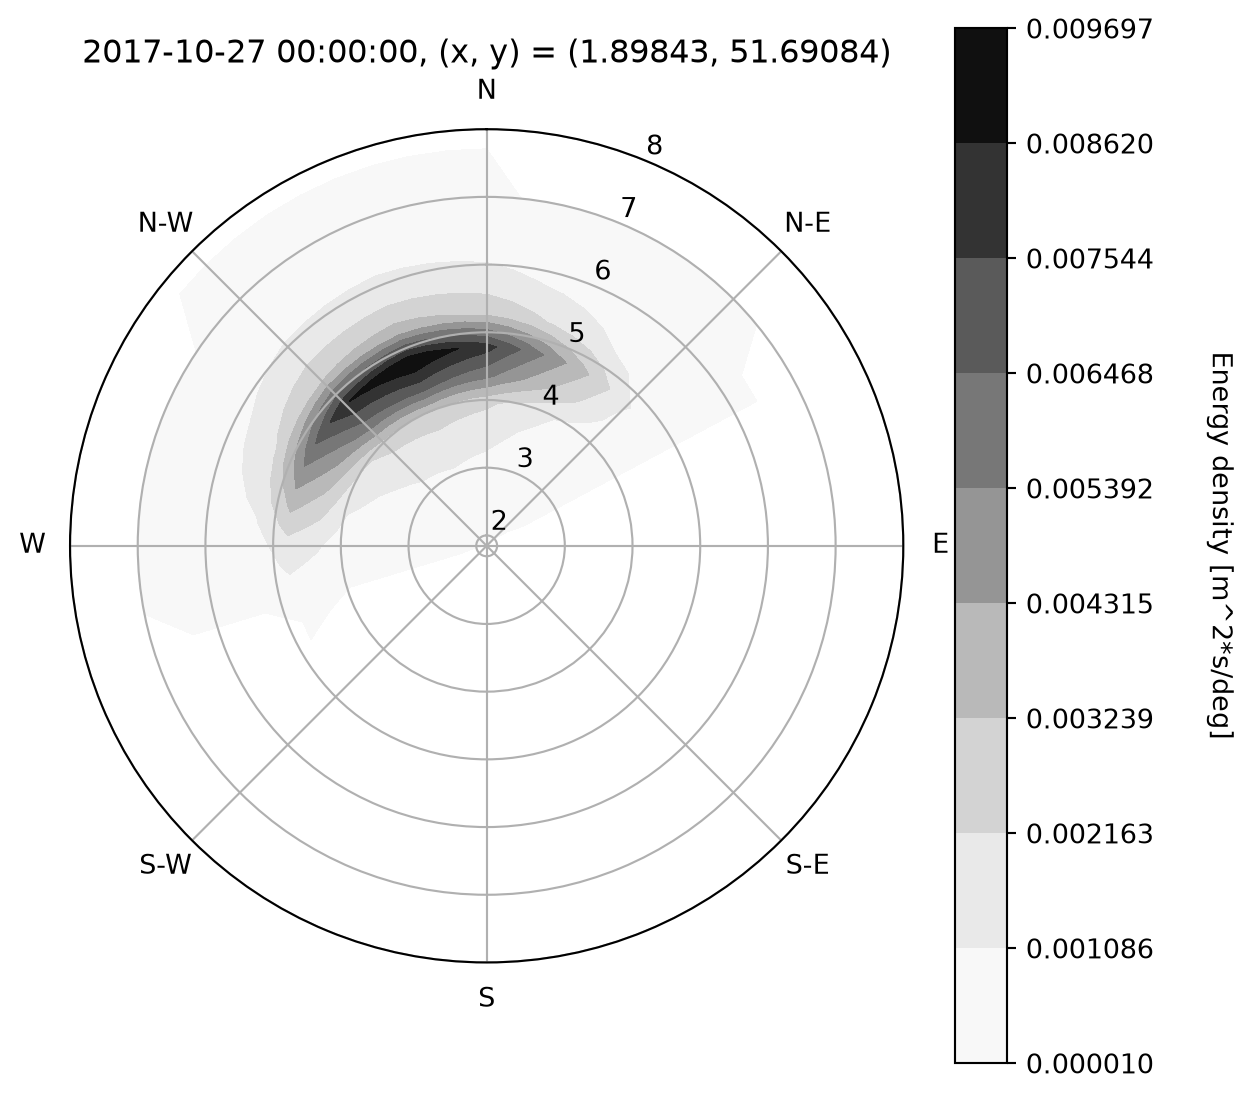
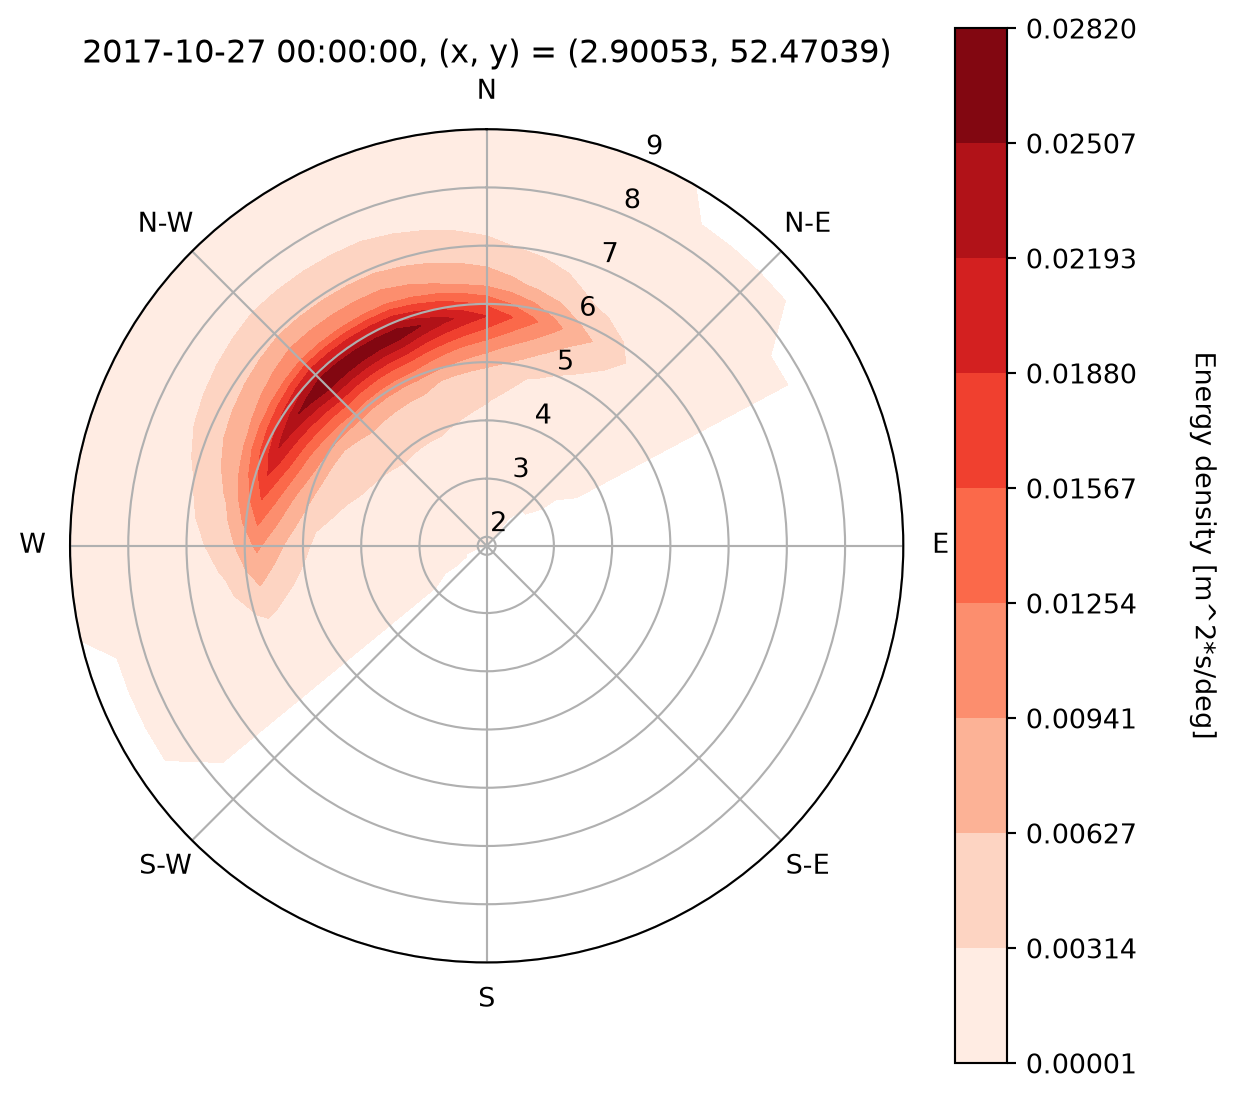
Selecting a position with sel gives back the spectrum there, which plots as a polar plot:
da_pt = da.sel(x=2.9, y=52.5)da_pt.plot(rmax=9);
Directional sectors
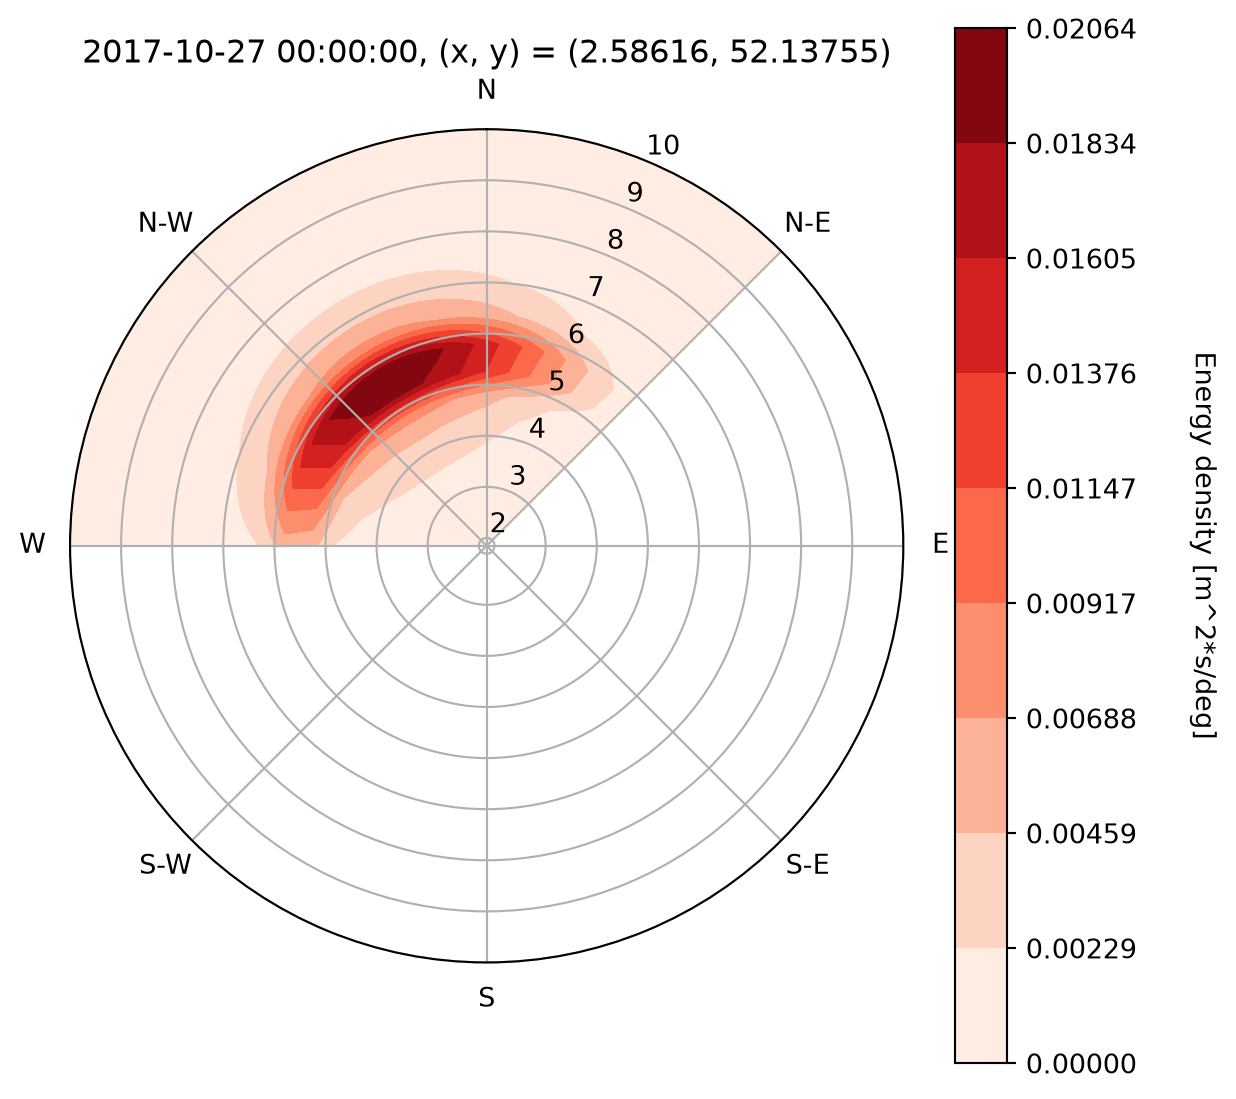
MIKE 21 SW can discretise directions over a sector rather than the full circle. Such files are read the same way, and the plot covers only the sector:
da = mikeio.read("../data/spectra/MIKE21SW_dir_sector_area_spectra.dfsu", time=0)["Energy density"]da.isel(element=0).plot(rmax=10, vmin=0);
Frequency and direction spectra
A file need not carry both axes. Frequency spectra have no directions, and directional spectra have no frequencies; n_frequencies and n_directions report which case you are in, one of them being zero.
da = mikeio.read("../data/spectra/pt_freq_spectra.dfsu")[0]da.geometry.n_frequencies, da.geometry.n_directions
(25, 0)
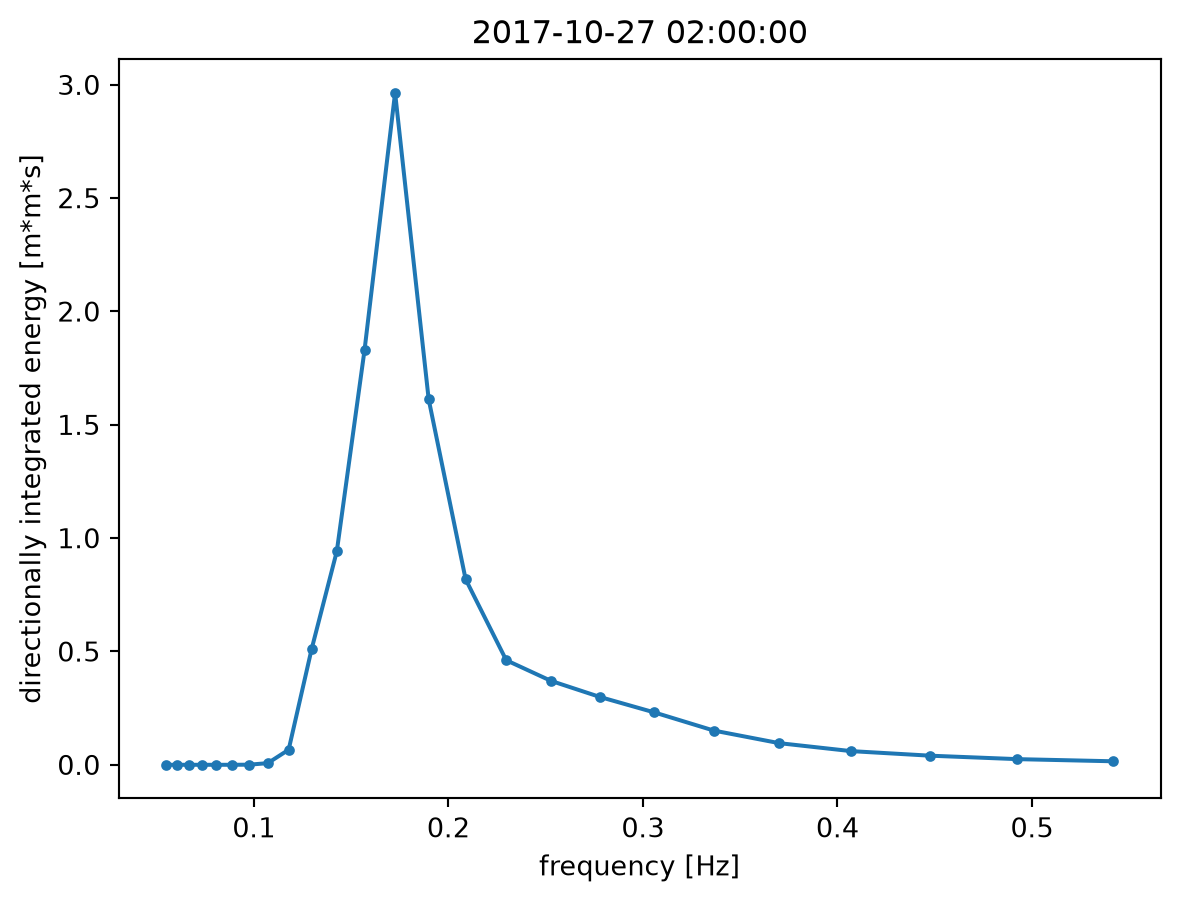
With no directions to plot around a circle, the plot becomes an ordinary spectrum against frequency:
da.sel(time="2017-10-27 02:00").plot();
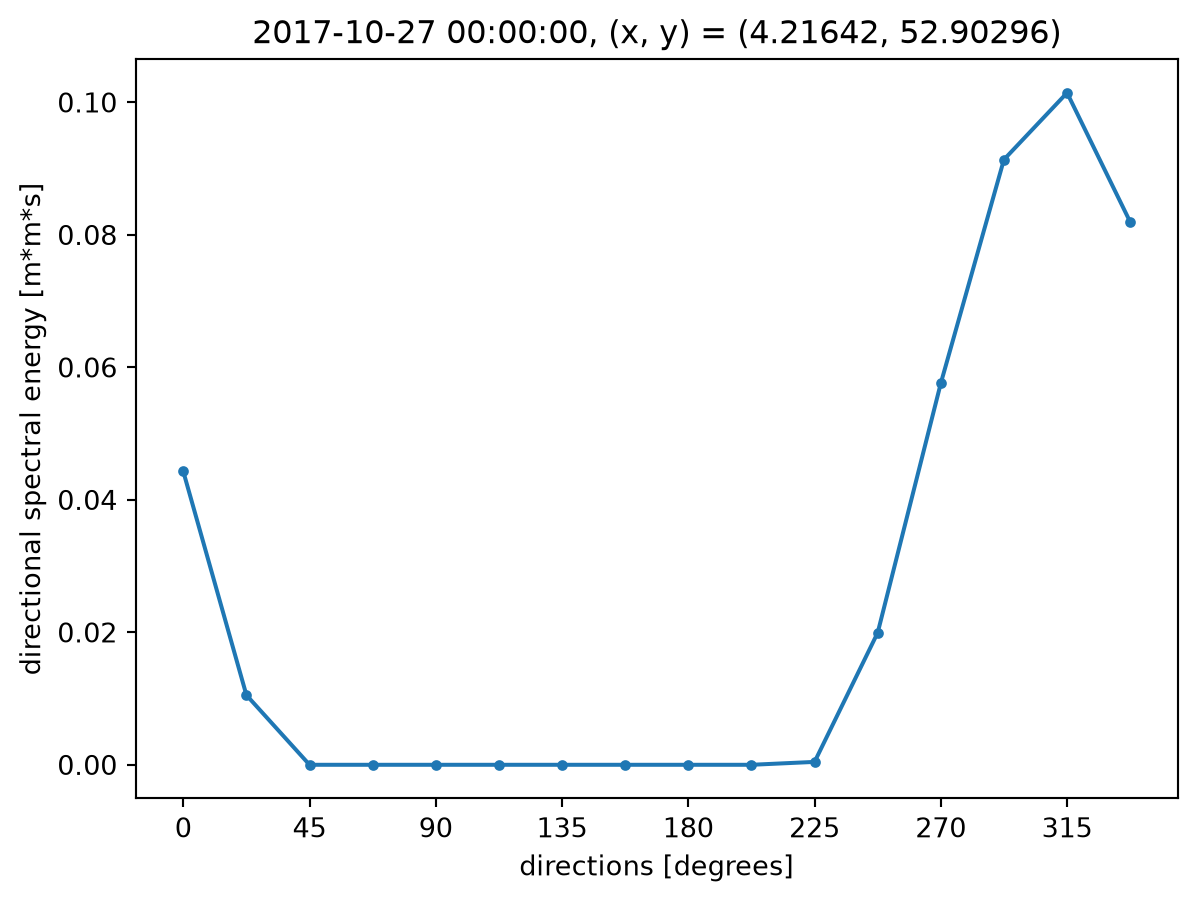
The reverse case, a directional spectrum with no frequency axis:
da = mikeio.read("../data/spectra/line_dir_spectra.dfsu")[0]da.geometry.n_frequencies, da.geometry.n_directions