import mikeio
da = mikeio.read("../data/gebco_sound.dfs2")["Elevation"]
da.plot()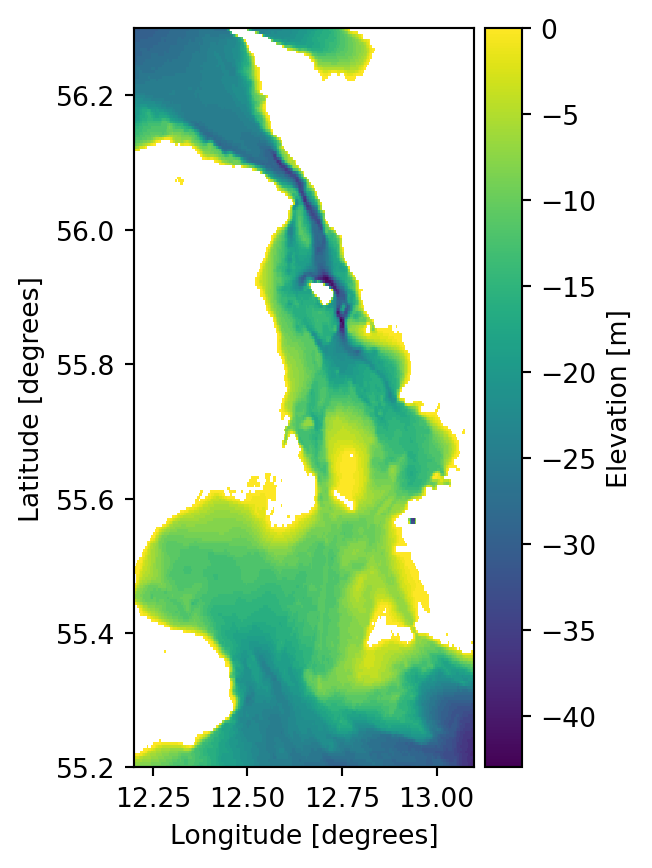
dataset._data_plot._DataArrayPlotterGrid2D(self, da)Plot a DataArray with a Grid2D geometry.
If DataArray has multiple time steps, the first step will be plotted.
import mikeio
da = mikeio.read("../data/gebco_sound.dfs2")["Elevation"]
da.plot()
| Name | Description |
|---|---|
| contour | Plot data as contour lines. |
| contourf | Plot data as filled contours. |
| hist | Plot DataArray as histogram (using ax.hist). |
| line | Plot data as lines (timeseries if time is present). |
| pcolormesh | Plot data as coloured patches. |
dataset._data_plot._DataArrayPlotterGrid2D.contour(
    ax=None,
    figsize=None,
    title=None,
    **kwargs,
)
Plot data as contour lines.
da = mikeio.read("../data/gebco_sound.dfs2")["Elevation"]
da.plot.contour()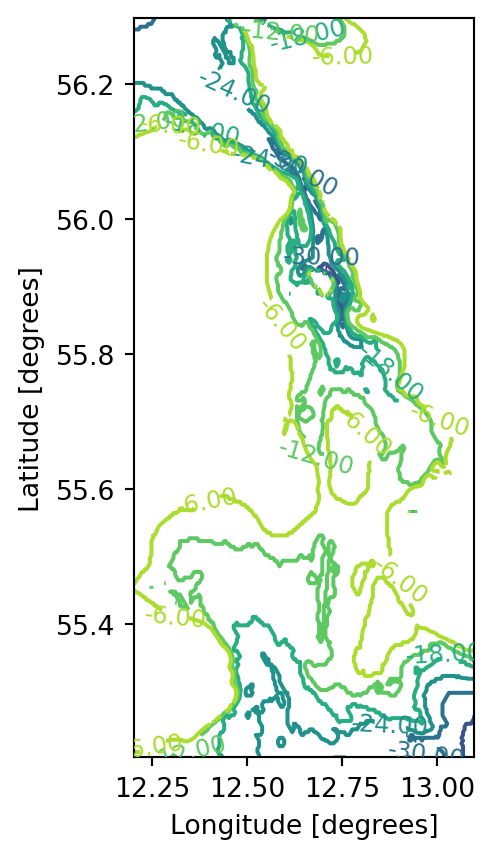
dataset._data_plot._DataArrayPlotterGrid2D.contourf(
    ax=None,
    figsize=None,
    title=None,
    label=None,
    **kwargs,
)
Plot data as filled contours.
da = mikeio.read("../data/gebco_sound.dfs2")["Elevation"]
da.plot.contourf()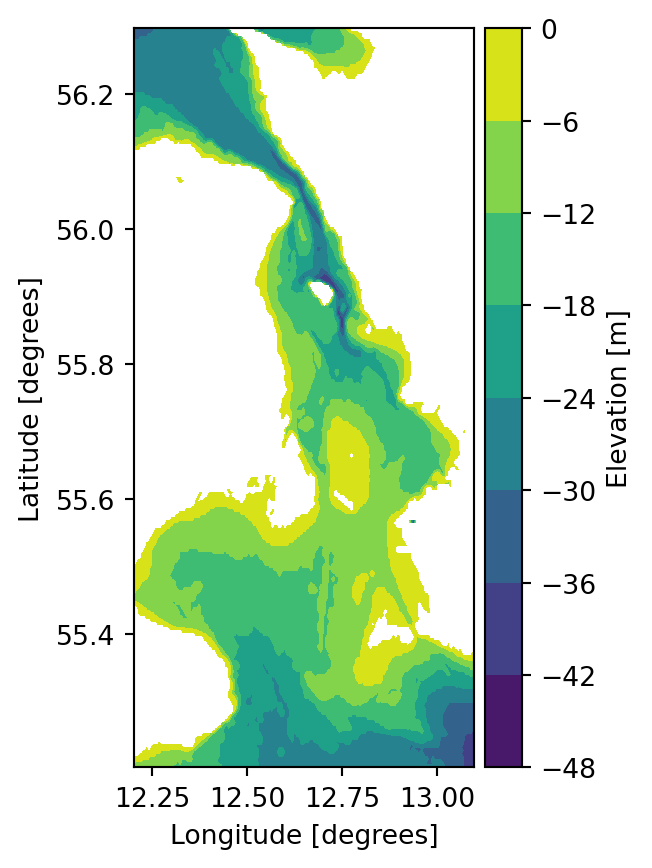
dataset._data_plot._DataArrayPlotterGrid2D.hist(
    ax=None,
    figsize=None,
    title=None,
    **kwargs,
)
Plot DataArray as histogram (using ax.hist).
| Name | Type | Description | Default |
|---|---|---|---|
| bins | (int or sequence or str) | If bins is an integer, it defines the number of equal-width bins in the range. If bins is a sequence, it defines the bin edges, including the left edge of the first bin and the right edge of the last bin. by default: rcParams[“hist.bins”] (default: 10) | required |
| ax | Axes | None | Adding to existing axis, instead of creating new fig | None |
| figsize | tuple[float, float] | None | specify size of figure | None |
| title | str | None | axes title | None |
| **kwargs | Any | additional arguments passed to the plotting function | {} |
matplotlib.pyplot.hist
| Name | Type | Description |
|---|---|---|
| <matplotlib.axes> |
dataset._data_plot._DataArrayPlotterGrid2D.line(ax=None, figsize=None, **kwargs)Plot data as lines (timeseries if time is present).
dataset._data_plot._DataArrayPlotterGrid2D.pcolormesh(
    ax=None,
    figsize=None,
    title=None,
    label=None,
    **kwargs,
)
Plot data as coloured patches.
da = mikeio.read("../data/gebco_sound.dfs2")["Elevation"]
da.plot.pcolormesh()