import mikeio
da = mikeio.read("../data/oresund_vertical_slice.dfsu")["Temperature"]
da.plot()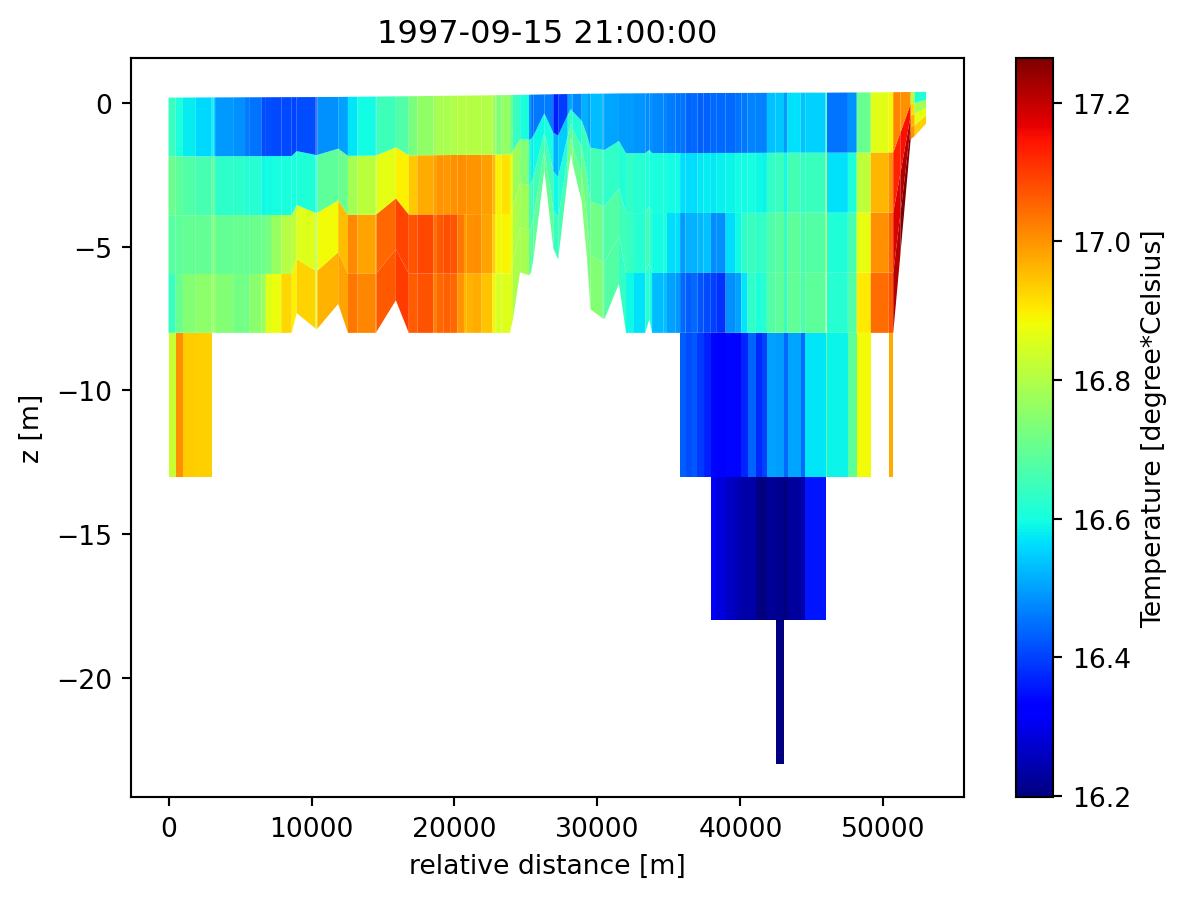
dataset._data_plot._DataArrayPlotterFMVerticalProfile(self, da)Plot a DataArray with a 2DV GeometryFMVerticalProfile geometry.
If DataArray has multiple time steps, the first step will be plotted.
import mikeio
da = mikeio.read("../data/oresund_vertical_slice.dfsu")["Temperature"]
da.plot()
da.plot.hist()(array([ 1., 2., 19., 70., 202., 384., 336., 167., 127., 15.]),
array([15.45340729, 15.63446045, 15.81551361, 15.99656582, 16.17761993,
16.3586731 , 16.53972435, 16.72077751, 16.90183067, 17.08288383,
17.263937 ]),
<BarContainer object of 10 artists>)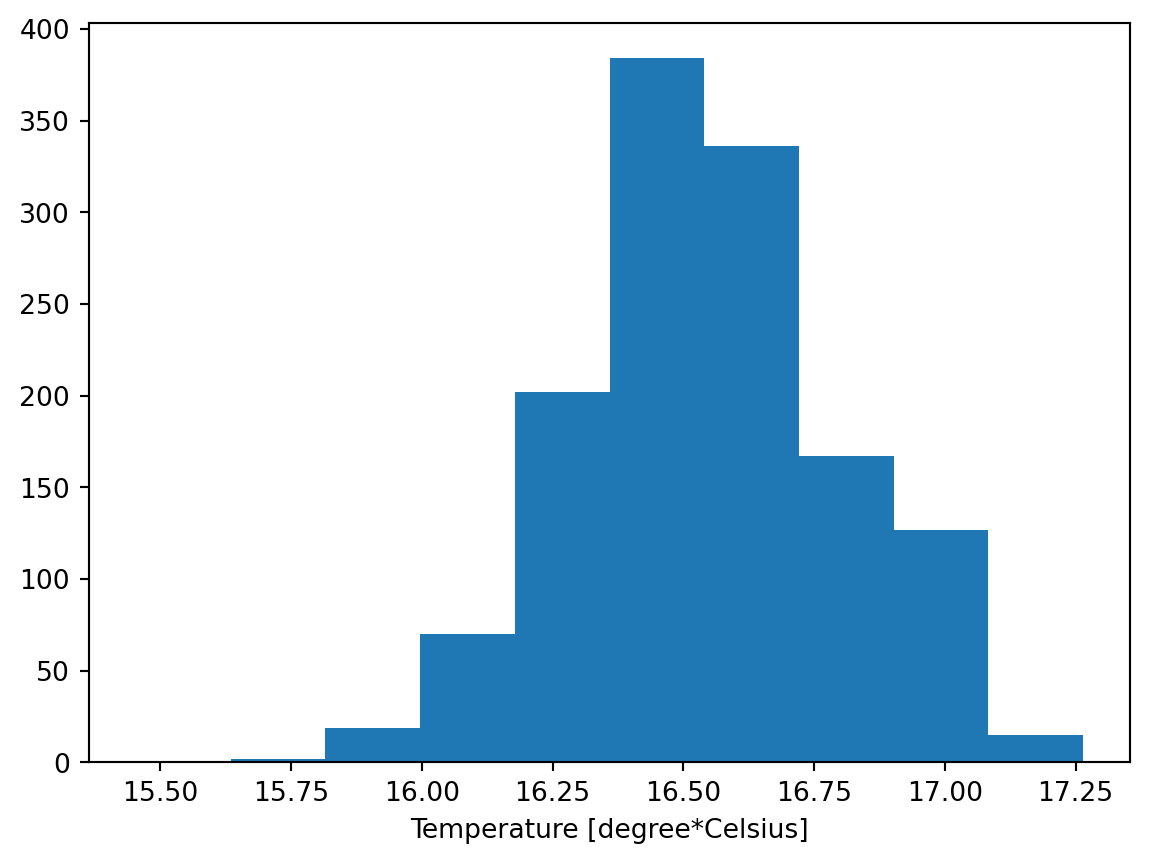
| Name | Description |
|---|---|
| hist | Plot DataArray as histogram (using ax.hist). |
| line | Plot data as lines (timeseries if time is present). |
dataset._data_plot._DataArrayPlotterFMVerticalProfile.hist(
    ax=None,
    figsize=None,
    title=None,
    **kwargs,
)
Plot DataArray as histogram (using ax.hist).
| Name | Type | Description | Default |
|---|---|---|---|
| bins | (int or sequence or str) | If bins is an integer, it defines the number of equal-width bins in the range. If bins is a sequence, it defines the bin edges, including the left edge of the first bin and the right edge of the last bin. by default: rcParams[“hist.bins”] (default: 10) | required |
| ax | Axes | None | Adding to existing axis, instead of creating new fig | None |
| figsize | tuple[float, float] | None | specify size of figure | None |
| title | str | None | axes title | None |
| **kwargs | Any | additional arguments passed to the plotting function | {} |
matplotlib.pyplot.hist
| Name | Type | Description |
|---|---|---|
| <matplotlib.axes> |
dataset._data_plot._DataArrayPlotterFMVerticalProfile.line(
    ax=None,
    figsize=None,
    **kwargs,
)
Plot data as lines (timeseries if time is present).