Dfsu 2D#
2D horizontal.
See Dfsu in MIKE IO Documentation
import numpy as np
import pandas as pd
import matplotlib.pyplot as plt
import mikeio
Basic properties#
Note
Example data can be found in the mini_book/data folder in this zip-file.
fn = "data/oresundHD_run1.dfsu"
dfs = mikeio.open(fn)
dfs
<mikeio.Dfsu2DH>
number of elements: 3612
number of nodes: 2046
projection: UTM-33
items:
  0:  Surface elevation <Surface Elevation> (meter)
  1:  Total water depth <Water Depth> (meter)
  2:  U velocity <u velocity component> (meter per sec)
  3:  V velocity <v velocity component> (meter per sec)
time: 2018-03-07 00:00:00 - 2018-03-11 00:00:00 (5 records)
dfs.geometry
Flexible Mesh Geometry: Dfsu2D
number of nodes: 2046
number of elements: 3612
projection: UTM-33
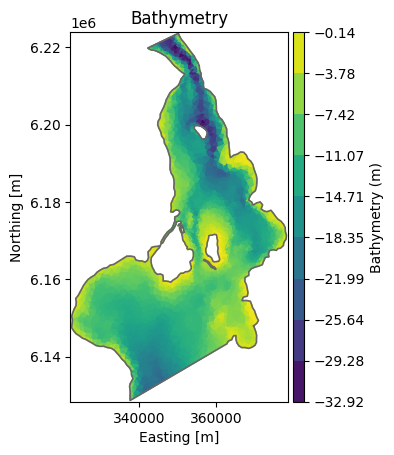
dfs.geometry.plot();
dfs.n_items
4
dfs.geometry.projection_string
'UTM-33'
dfs.timestep # in seconds ...
86400.0
ds = dfs.read(items="Surface elevation")
ds.shape
(5, 3612)
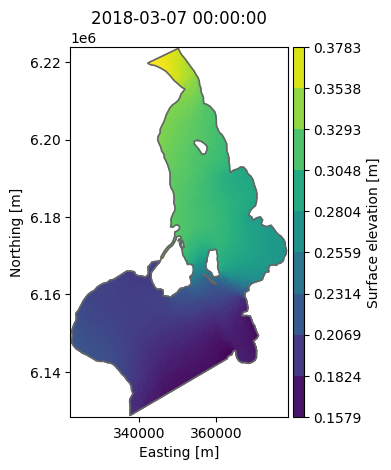
da = ds["Surface elevation"]   # =ds[0] = ds.Surface_elevation
da
<mikeio.DataArray>
name: Surface elevation
dims: (time:5, element:3612)
time: 2018-03-07 00:00:00 - 2018-03-11 00:00:00 (5 records)
geometry: Dfsu2D (3612 elements, 2046 nodes)
da.plot();
Subset data#
ze = dfs.geometry.element_coordinates[:,2]    # third column is depth
ze<-20
array([False, False, False, ..., False, False, False], shape=(3612,))
elems = np.where(ze<-20)[0]
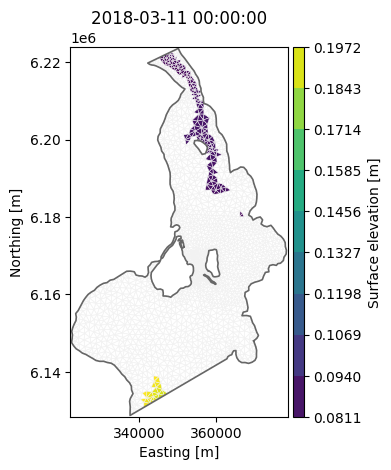
ds_sub = dfs.read(items=0, time=-1, elements=elems) # read only data where depth is more than 20m
ds_sub
<mikeio.Dataset>
dims: (element:202)
time: 2018-03-11 00:00:00 (time-invariant)
geometry: Dfsu2D (202 elements, 166 nodes)
items:
  0:  Surface elevation <Surface Elevation> (meter)
ax = ds_sub[0].plot()
dfs.geometry.plot.mesh(ax=ax);
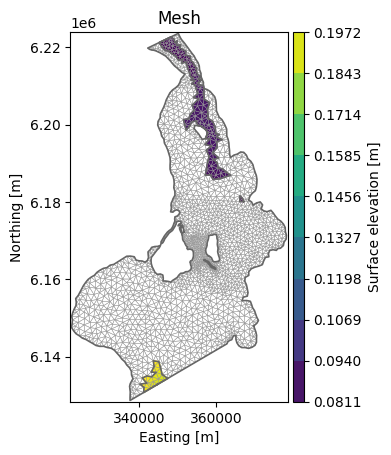
Alternatively, we can use boolean masking directly on the DataArray, like this (see also DataArray_Masking.ipynb):
dac = ds[0].isel(time=-1).copy()
dac[ze>=-20] = np.nan
dac.plot(show_mesh=True);
Inline exercise#
Find the ids for the elements North of y=6.19e6
How many elements are North of this line?
Plot the surface in this part of the domain
# insert your code here
Create new dfsu from mesh#
fn = "data/two_elements.mesh"
msh = mikeio.open(fn)
data = 36.5 * np.ones(msh.n_elements)            # set all elements to 36.5
time = pd.date_range("2020-1-1", periods=1)      # arbitrary date
item = mikeio.ItemInfo(mikeio.EUMType.Chezy_No)
da = mikeio.DataArray(data, time=time, item=item, geometry=msh.geometry)
da.to_dfs("chezy_map.dfsu")
msh = mikeio.open("chezy_map.dfsu")
msh.read()[0][0,:]
<mikeio.DataArray>
name: Chezy No
dims: (element:2)
time: 2020-01-01 00:00:00 (time-invariant)
geometry: Dfsu2D (2 elements, 4 nodes)
values: [36.5, 36.5]
Visualisation#
msh = mikeio.open("data/oresundHD_run1.dfsu")
msh
<mikeio.Dfsu2DH>
number of elements: 3612
number of nodes: 2046
projection: UTM-33
items:
  0:  Surface elevation <Surface Elevation> (meter)
  1:  Total water depth <Water Depth> (meter)
  2:  U velocity <u velocity component> (meter per sec)
  3:  V velocity <v velocity component> (meter per sec)
time: 2018-03-07 00:00:00 - 2018-03-11 00:00:00 (5 records)
The Dfsu geometry plot the same as the mesh. (plot the elements and color them according to the bathymetry).
The DataArray can be used to plot other data, such as surface elevation.
msh.geometry.plot();
ds = msh.read()
ds
<mikeio.Dataset>
dims: (time:5, element:3612)
time: 2018-03-07 00:00:00 - 2018-03-11 00:00:00 (5 records)
geometry: Dfsu2D (3612 elements, 2046 nodes)
items:
  0:  Surface elevation <Surface Elevation> (meter)
  1:  Total water depth <Water Depth> (meter)
  2:  U velocity <u velocity component> (meter per sec)
  3:  V velocity <v velocity component> (meter per sec)
wl_laststep = ds["Surface elevation"].isel(time=-1)   # DataArray
wl_laststep
<mikeio.DataArray>
name: Surface elevation
dims: (element:3612)
time: 2018-03-11 00:00:00 (time-invariant)
geometry: Dfsu2D (3612 elements, 2046 nodes)
values: [0.08848, 0.1241, ..., 0.08814]
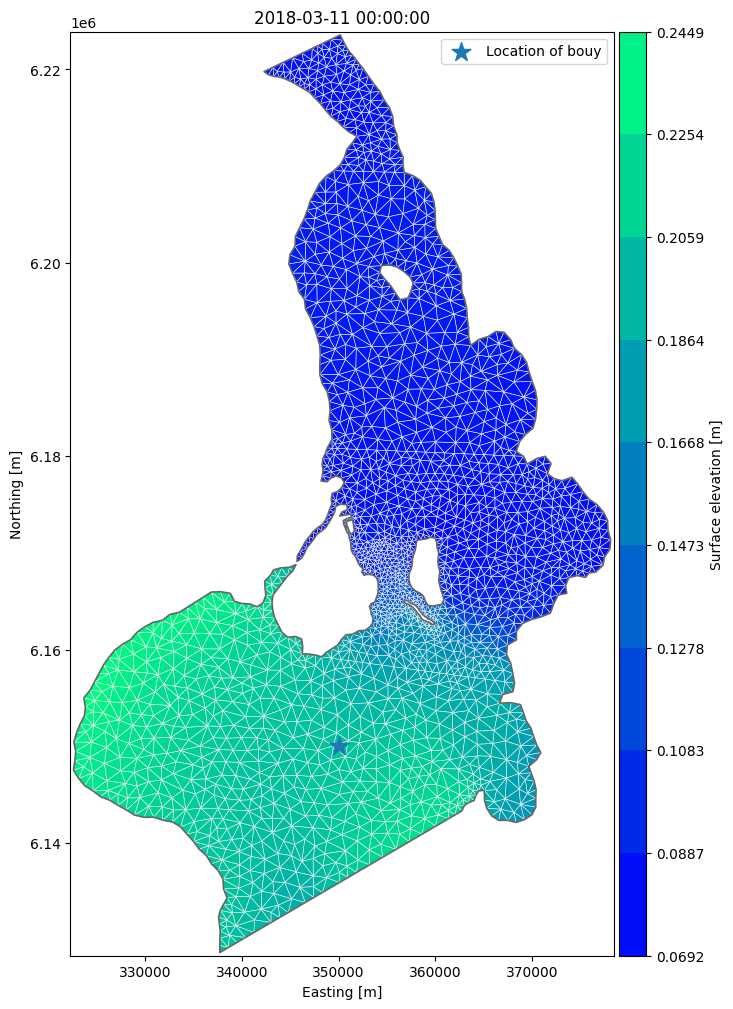
In order to customize the plot we can take return the axis and add additional things, like markers and a legend.
ax = wl_laststep.plot(cmap="winter", show_mesh=True, figsize=(12,12))
ax.scatter(x=350000, y=6.15e6, marker='*', s=200, label="Location of bouy")
ax.legend();
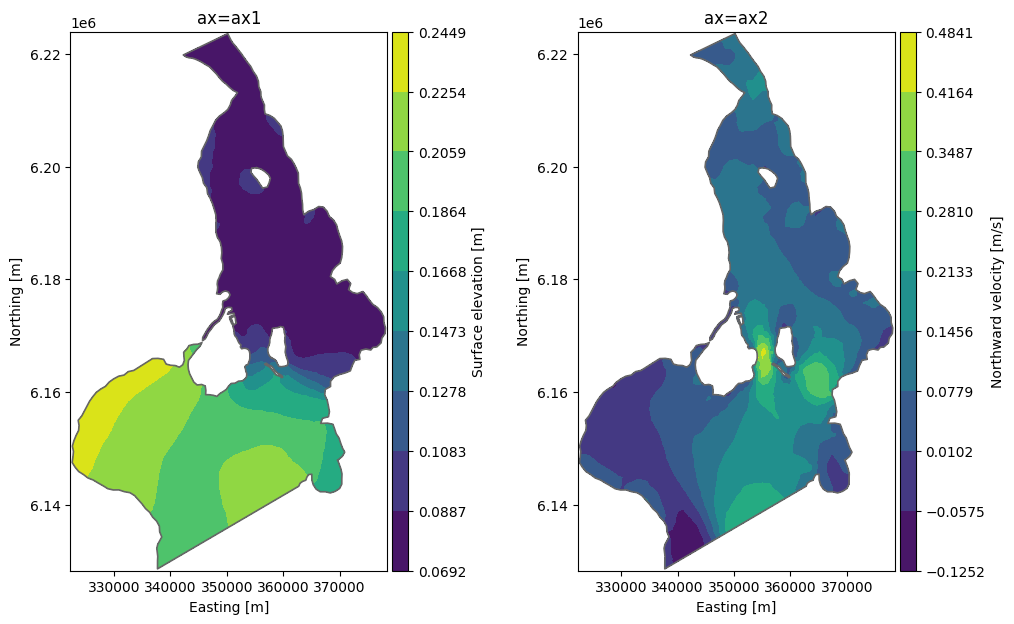
In order to create subplots, we can supply the axis as an argument to plot.
fig, (ax1, ax2) = plt.subplots(ncols=2, figsize = (12,7))

da = ds["Surface elevation"].isel(time=-1)
da.plot.contourf(ax=ax1, title="ax=ax1")

da = ds["V velocity"].isel(time=-1)
da.plot.contourf(ax=ax2, title="ax=ax2", label="Northward velocity [m/s]");
More examples#
See the MIKE IO example notebooks which has “dfsu” in the name.
import utils

utils.sysinfo()
    System: 3.11.14 (main, Oct 10 2025, 01:03:14) [GCC 13.3.0]
    NumPy: 2.4.2
    Pandas: 3.0.1
    MIKE IO: 3.0.1
    Last modified: 2026-03-05 10:03:10.928038