Dfs0#
See Dfs0 in MIKE IO Documentation
import pandas as pd
import mikeio
Reading data#
ds = mikeio.read("data/Oresund_ts.dfs0")
ds
<mikeio.Dataset>
dims: (time:2017)
time: 2018-03-04 00:00:00 - 2018-03-11 00:00:00 (2017 records)
geometry: GeometryUndefined()
number of items: 12
type(ds)
mikeio.dataset._dataset.Dataset
The mikeio read function returns a Dataset which is a container of DataArrays.
A DataArray can be selected by name or by index.
da = ds["Drogden: Surface elevation"]   # or ds.Drogden_Surface_elevation or ds[2]
da
<mikeio.DataArray>
name: Drogden: Surface elevation
dims: (time:2017)
time: 2018-03-04 00:00:00 - 2018-03-11 00:00:00 (2017 records)
geometry: GeometryUndefined()
values: [0.05063, 0.04713, ..., 0.2404]
Upon read, specific items can be selected with the items argument using name or index.
ds = mikeio.read("data/Oresund_ts.dfs0", items=[0,2,3])
ds
<mikeio.Dataset>
dims: (time:2017)
time: 2018-03-04 00:00:00 - 2018-03-11 00:00:00 (2017 records)
geometry: GeometryUndefined()
items:
  0:  Viken: Surface elevation <Surface Elevation> (meter)
  1:  Drogden: Surface elevation <Surface Elevation> (meter)
  2:  Klagshamn: Surface elevation <Surface Elevation> (meter)
Wildcards can be used to select multiple items:
ds = mikeio.read("data/Oresund_ts.dfs0", items="*Surf*")
ds
<mikeio.Dataset>
dims: (time:2017)
time: 2018-03-04 00:00:00 - 2018-03-11 00:00:00 (2017 records)
geometry: GeometryUndefined()
items:
  0:  Viken: Surface elevation <Surface Elevation> (meter)
  1:  Hornbæk: Surface elevation <Surface Elevation> (meter)
  2:  Drogden: Surface elevation <Surface Elevation> (meter)
  3:  Klagshamn: Surface elevation <Surface Elevation> (meter)
A specific time subset can be using .sel:
ds.sel(time=slice("2018-03-04","2018-03-04 12:00"))
<mikeio.Dataset>
dims: (time:145)
time: 2018-03-04 00:00:00 - 2018-03-04 12:00:00 (145 records)
geometry: GeometryUndefined()
items:
  0:  Viken: Surface elevation <Surface Elevation> (meter)
  1:  Hornbæk: Surface elevation <Surface Elevation> (meter)
  2:  Drogden: Surface elevation <Surface Elevation> (meter)
  3:  Klagshamn: Surface elevation <Surface Elevation> (meter)
Or with positional indexing using .isel:
ds.isel(time=slice(10,20))
<mikeio.Dataset>
dims: (time:10)
time: 2018-03-04 00:50:00 - 2018-03-04 01:35:00 (10 records)
geometry: GeometryUndefined()
items:
  0:  Viken: Surface elevation <Surface Elevation> (meter)
  1:  Hornbæk: Surface elevation <Surface Elevation> (meter)
  2:  Drogden: Surface elevation <Surface Elevation> (meter)
  3:  Klagshamn: Surface elevation <Surface Elevation> (meter)
The Dataset and DataArray have a number of useful attributes like time, items, ndims, shape, values (only DataArray) etc
ds.time
DatetimeIndex(['2018-03-04 00:00:00', '2018-03-04 00:05:00',
               '2018-03-04 00:10:00', '2018-03-04 00:15:00',
               '2018-03-04 00:20:00', '2018-03-04 00:25:00',
               '2018-03-04 00:30:00', '2018-03-04 00:35:00',
               '2018-03-04 00:40:00', '2018-03-04 00:45:00',
               ...
               '2018-03-10 23:15:00', '2018-03-10 23:20:00',
               '2018-03-10 23:25:00', '2018-03-10 23:30:00',
               '2018-03-10 23:35:00', '2018-03-10 23:40:00',
               '2018-03-10 23:45:00', '2018-03-10 23:50:00',
               '2018-03-10 23:55:00', '2018-03-11 00:00:00'],
              dtype='datetime64[s]', length=2017, freq=None)
ds.items
[Viken: Surface elevation <Surface Elevation> (meter),
 Hornbæk: Surface elevation <Surface Elevation> (meter),
 Drogden: Surface elevation <Surface Elevation> (meter),
 Klagshamn: Surface elevation <Surface Elevation> (meter)]
da.item
Drogden: Surface elevation <Surface Elevation> (meter)
da.shape
(2017,)
da.values
array([0.05062908, 0.04713159, 0.04382962, ..., 0.23521478, 0.23782268,
       0.24038477], shape=(2017,))
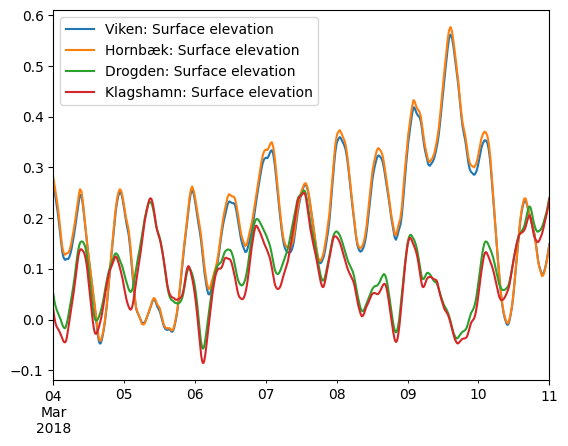
The time series can be plotted with the plot method.
ds.plot();

A simple timeseries Dataset can easily be converted to a Pandas DataFrame.
df = ds.to_pandas()
df
| Viken: Surface elevation | Hornbæk: Surface elevation | Drogden: Surface elevation | Klagshamn: Surface elevation | |
|---|---|---|---|---|
| 2018-03-04 00:00:00 | 0.268416 | 0.279761 | 0.050629 | 0.018723 |
| 2018-03-04 00:05:00 | 0.265478 | 0.276792 | 0.047132 | 0.014833 |
| 2018-03-04 00:10:00 | 0.262521 | 0.273909 | 0.043830 | 0.011230 |
| 2018-03-04 00:15:00 | 0.259481 | 0.270935 | 0.040655 | 0.007876 |
| 2018-03-04 00:20:00 | 0.256348 | 0.267858 | 0.037621 | 0.004712 |
| ... | ... | ... | ... | ... |
| 2018-03-10 23:40:00 | 0.136196 | 0.134429 | 0.230030 | 0.225920 |
| 2018-03-10 23:45:00 | 0.139276 | 0.137607 | 0.232610 | 0.229034 |
| 2018-03-10 23:50:00 | 0.142336 | 0.140712 | 0.235215 | 0.232193 |
| 2018-03-10 23:55:00 | 0.145396 | 0.143796 | 0.237823 | 0.235325 |
| 2018-03-11 00:00:00 | 0.148458 | 0.146873 | 0.240385 | 0.238351 |
2017 rows × 4 columns
Writing data#
Often, time series data will come from a csv or an Excel file. Here is an example of how to read a csv file with pandas and then write the pandas DataFrame to a dfs0 file.
df = pd.read_csv("data/naples_fl.csv", skiprows=1, parse_dates=True, index_col=0)
df
| TAVG (Degrees Fahrenheit) | TMAX (Degrees Fahrenheit) | TMIN (Degrees Fahrenheit) | PRCP (Inches) | SNOW (Inches) | SNWD (Inches) | |
|---|---|---|---|---|---|---|
| Date | ||||||
| 2002-03-01 | 67.0 | 78.0 | 56.0 | 0.00 | NaN | NaN |
| 2002-03-02 | 76.0 | 83.0 | 69.0 | 0.00 | NaN | NaN |
| 2002-03-03 | 78.0 | 84.0 | 71.0 | 0.00 | NaN | NaN |
| 2002-03-04 | 64.0 | 76.0 | 51.0 | 0.08 | NaN | NaN |
| 2002-03-05 | 58.0 | 70.0 | 45.0 | 0.00 | NaN | NaN |
| ... | ... | ... | ... | ... | ... | ... |
| 2021-08-11 | NaN | 93.0 | 77.0 | 0.23 | NaN | NaN |
| 2021-08-12 | NaN | 94.0 | 77.0 | 0.00 | 0.0 | 0.0 |
| 2021-08-13 | NaN | 95.0 | 77.0 | 0.03 | 0.0 | 0.0 |
| 2021-08-14 | NaN | 85.0 | 74.0 | 0.05 | 0.0 | 0.0 |
| 2021-08-15 | NaN | 83.0 | 75.0 | 0.01 | 0.0 | 0.0 |
7108 rows × 6 columns
You will probably have the need to parse certain a specific data formats many times, then it is a good idea to create a function.
def read_ncei_obs(filename):
    # old name : new name
    mapping = {'TAVG (Degrees Fahrenheit)': 'temperature_avg_f',
               'TMAX (Degrees Fahrenheit)': 'temperature_max_f',
               'TMIN (Degrees Fahrenheit)': 'temperature_min_f',
               'PRCP (Inches)': 'prec_in'}

    df_renamed = (
        pd.read_csv(filename, skiprows=1, parse_dates=True, index_col=0)
           .rename(columns=mapping)
    )
    sel_cols = mapping.values() # No need to repeat ['temperature_avg_f',...]
    df_selected = df_renamed[sel_cols]
    return df_selected
df = read_ncei_obs("data/naples_fl.csv")
df.head()
| temperature_avg_f | temperature_max_f | temperature_min_f | prec_in | |
|---|---|---|---|---|
| Date | ||||
| 2002-03-01 | 67.0 | 78.0 | 56.0 | 0.00 |
| 2002-03-02 | 76.0 | 83.0 | 69.0 | 0.00 |
| 2002-03-03 | 78.0 | 84.0 | 71.0 | 0.00 |
| 2002-03-04 | 64.0 | 76.0 | 51.0 | 0.08 |
| 2002-03-05 | 58.0 | 70.0 | 45.0 | 0.00 |
df.tail()
| temperature_avg_f | temperature_max_f | temperature_min_f | prec_in | |
|---|---|---|---|---|
| Date | ||||
| 2021-08-11 | NaN | 93.0 | 77.0 | 0.23 |
| 2021-08-12 | NaN | 94.0 | 77.0 | 0.00 |
| 2021-08-13 | NaN | 95.0 | 77.0 | 0.03 |
| 2021-08-14 | NaN | 85.0 | 74.0 | 0.05 |
| 2021-08-15 | NaN | 83.0 | 75.0 | 0.01 |
df.shape
(7108, 4)
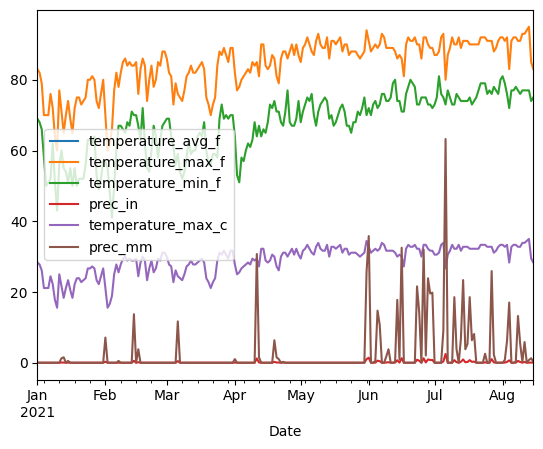
Convert temperature to Celsius and precipitation to mm.
df_final = df.assign(temperature_max_c=(df['temperature_max_f'] - 32)/1.8,
                     prec_mm=df['prec_in'] * 25.4)

df_final.head()
| temperature_avg_f | temperature_max_f | temperature_min_f | prec_in | temperature_max_c | prec_mm | |
|---|---|---|---|---|---|---|
| Date | ||||||
| 2002-03-01 | 67.0 | 78.0 | 56.0 | 0.00 | 25.555556 | 0.000 |
| 2002-03-02 | 76.0 | 83.0 | 69.0 | 0.00 | 28.333333 | 0.000 |
| 2002-03-03 | 78.0 | 84.0 | 71.0 | 0.00 | 28.888889 | 0.000 |
| 2002-03-04 | 64.0 | 76.0 | 51.0 | 0.08 | 24.444444 | 2.032 |
| 2002-03-05 | 58.0 | 70.0 | 45.0 | 0.00 | 21.111111 | 0.000 |
df_final.loc['2021'].plot();

Creating a dfs0 file from a dataframe is pretty straightforward.
Convert the dataframe to a
Dataset
ds = mikeio.from_pandas(df_final)
ds
<mikeio.Dataset>
dims: (time:7108)
time: 2002-03-01 00:00:00 - 2021-08-15 00:00:00 (7108 records)
geometry: GeometryUndefined()
items:
  0:  temperature_avg_f <Undefined> (undefined)
  1:  temperature_max_f <Undefined> (undefined)
  2:  temperature_min_f <Undefined> (undefined)
  3:  prec_in <Undefined> (undefined)
  4:  temperature_max_c <Undefined> (undefined)
  5:  prec_mm <Undefined> (undefined)
Write the
Datasetto a dfs0 file.
ds.to_dfs("output/naples_fl.dfs0")
Let’s read it back in again…
saved_ds = mikeio.read("output/naples_fl.dfs0")
saved_ds
<mikeio.Dataset>
dims: (time:7108)
time: 2002-03-01 00:00:00 - 2021-08-15 00:00:00 (7108 records)
geometry: GeometryUndefined()
items:
  0:  temperature_avg_f <Undefined> (undefined)
  1:  temperature_max_f <Undefined> (undefined)
  2:  temperature_min_f <Undefined> (undefined)
  3:  prec_in <Undefined> (undefined)
  4:  temperature_max_c <Undefined> (undefined)
  5:  prec_mm <Undefined> (undefined)
By default, EUM types are undefined. But it can be specified. Let’s select a few colums.
df2 = df_final[['temperature_max_c', 'prec_in']]
df2.head()
| temperature_max_c | prec_in | |
|---|---|---|
| Date | ||
| 2002-03-01 | 25.555556 | 0.00 |
| 2002-03-02 | 28.333333 | 0.00 |
| 2002-03-03 | 28.888889 | 0.00 |
| 2002-03-04 | 24.444444 | 0.08 |
| 2002-03-05 | 21.111111 | 0.00 |
from mikeio import ItemInfo, EUMType, EUMUnit

ds2 = mikeio.from_pandas(df2,
                         items=[
                   ItemInfo(EUMType.Temperature),
                   ItemInfo(EUMType.Precipitation_Rate, EUMUnit.inch_per_day)]
           )
ds2
<mikeio.Dataset>
dims: (time:7108)
time: 2002-03-01 00:00:00 - 2021-08-15 00:00:00 (7108 records)
geometry: GeometryUndefined()
items:
  0:  temperature_max_c <Temperature> (degree Celsius)
  1:  prec_in <Precipitation Rate> (inch per day)
EUM#
from mikeio.eum import ItemInfo, EUMType, EUMUnit

EUMType.search("wind")
[Wind Velocity,
 Wind Direction,
 Wind friction factor,
 Wind speed,
 Depth of Wind,
 Wind friction speed]
EUMType.Wind_speed.units
[meter per sec, feet per sec, knot, km per hour, miles per hour]
Inline Exercise#
What is the best EUM Type for “peak wave direction”? What is the default unit?
# insert your code here
Precipitation data#
df = pd.read_csv("data/precipitation.csv", parse_dates=True, index_col=0)
df.head()
| Precipitation station 1 | Precipitation station 2 | Precipitation station 3 | Precipitation station 4 | Precipitation station 5 | Precipitation station 6 | Precipitation station 7 | Precipitation station 8 | Precipitation station 9 | |
|---|---|---|---|---|---|---|---|---|---|
| date | |||||||||
| 2001-01-01 | 0.0 | 0.000 | 0.021 | 0.071 | 0.000 | 0.000 | 0.025 | 0.025 | 0.000 |
| 2001-01-02 | 0.0 | 0.025 | 0.037 | 0.000 | 0.004 | 0.054 | 0.042 | 0.021 | 0.054 |
| 2001-01-03 | 0.0 | 0.000 | 0.000 | 0.000 | 0.000 | 0.000 | 0.000 | 0.042 | 0.000 |
| 2001-01-04 | 0.0 | 0.000 | 0.000 | 0.000 | 0.000 | 0.000 | 0.000 | 0.000 | 0.000 |
| 2001-01-05 | 0.0 | 0.000 | 0.158 | 0.021 | 0.000 | 0.000 | 0.017 | 0.021 | 0.000 |
from mikecore.DfsFile import DataValueType

(mikeio.from_pandas(df, items=ItemInfo(EUMType.Precipitation_Rate, EUMUnit.mm_per_hour, data_value_type=DataValueType.MeanStepBackward))
        .to_dfs("output/precipitation.dfs0")
)
Selecting#
ds = mikeio.read("output/precipitation.dfs0", items=[1,4]) # select item by item number (starting from zero)
ds
<mikeio.Dataset>
dims: (time:31)
time: 2001-01-01 00:00:00 - 2001-01-31 00:00:00 (31 records)
geometry: GeometryUndefined()
items:
  0:  Precipitation station 2 <Precipitation Rate> (mm per hour) - 3
  1:  Precipitation station 5 <Precipitation Rate> (mm per hour) - 3
ds = mikeio.read("output/precipitation.dfs0", items=["Precipitation station 5","Precipitation station 1"]) # or by name (in the order you like it)
ds
<mikeio.Dataset>
dims: (time:31)
time: 2001-01-01 00:00:00 - 2001-01-31 00:00:00 (31 records)
geometry: GeometryUndefined()
items:
  0:  Precipitation station 5 <Precipitation Rate> (mm per hour) - 3
  1:  Precipitation station 1 <Precipitation Rate> (mm per hour) - 3
Inline Exercise#
Read all items to a variable ds. Select “Precipitation station 3” - which different ways can you select this item?
# insert your code here
import utils

utils.sysinfo()
    System: 3.11.14 (main, Oct 10 2025, 01:03:14) [GCC 13.3.0]
    NumPy: 2.4.2
    Pandas: 3.0.0
    MIKE IO: 3.0.1
    Last modified: 2026-02-10 13:11:56.806886

