Output statistics#
After running your MIKE simulation, you would often want to make different kinds of summary statistics of your data - both for your own understanding and for communicating your results.
Examples of statistics
Min, max, mean, standard deviation
Quantiles/percentiles (e.g. median, interquartile range, return period etc)
Probability/frequency of exceedance
Types of aggregations
Total - aggregate all data to a single number
Temporal - aggregate all time steps; for a dfsu 2d, the result would be a map
Spatial - aggregate all elements to a single value per time step
Others: monthly, by layer, spatial bin, sub domain etc…
Ways of calculating
mikeio.generic (temporal aggregations only; larger-than-memory)
custom code (typically with NumPy)
import mikeio
import mikeio.generic as generic
Dataset#
For smaller dfs files (maybe up to 2GB) it can be convenient to read the data to memory before doing aggregations. The MIKEIO.Dataset class have several methods for aggregating data along an axis. See the generic section below for larger-than-memory data.
ds = mikeio.read("data/NorthSea_HD_and_windspeed.dfsu")
ds
<mikeio.Dataset>
dims: (time:67, element:958)
time: 2017-10-27 00:00:00 - 2017-10-29 18:00:00 (67 records)
geometry: Dfsu2D (958 elements, 570 nodes)
items:
  0:  Surface elevation <Surface Elevation> (meter)
  1:  Wind speed <Wind speed> (meter per sec)
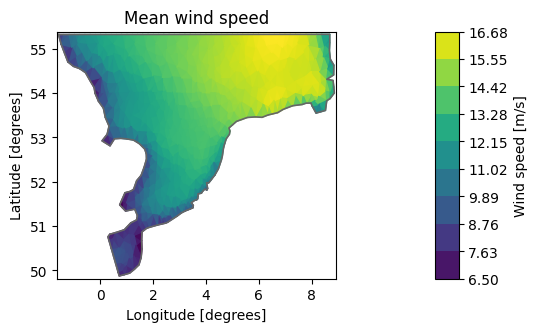
Temporal aggregations: mean#
The default is to aggregate along the time axis - the output will therefore be a map.
dsm  = ds.mean()
mean_ws = dsm["Wind speed"]
mean_ws.shape
(958,)
mean_ws.plot(title="Mean wind speed");
Spatial aggregations#
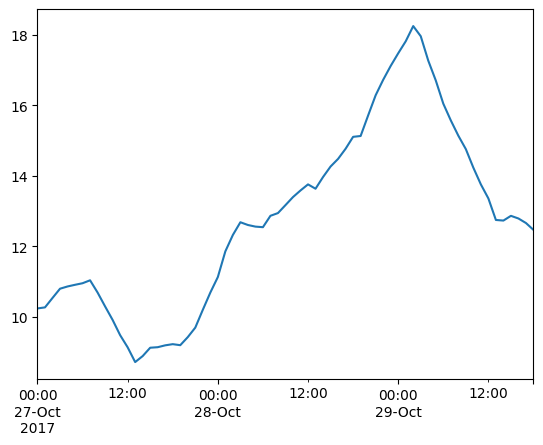
The Dataset aggregation methods (e.g. mean) takes an axis argument. If we give it the spatial axis (or the string ‘space’), it will produce a time series of spatially aggregated values.
Note
It’s important to note that the spatial aggregations here ignores element areas! Only average takes a weights argument.
df = ds.mean(axis="space").to_dataframe()
df.head()
| Surface elevation | Wind speed | |
|---|---|---|
| 2017-10-27 00:00:00 | 0.256916 | 10.234554 |
| 2017-10-27 01:00:00 | 0.274964 | 10.264292 |
| 2017-10-27 02:00:00 | 0.287414 | 10.531686 |
| 2017-10-27 03:00:00 | 0.290940 | 10.794677 |
| 2017-10-27 04:00:00 | 0.287235 | 10.858319 |
df['Wind speed'].plot();
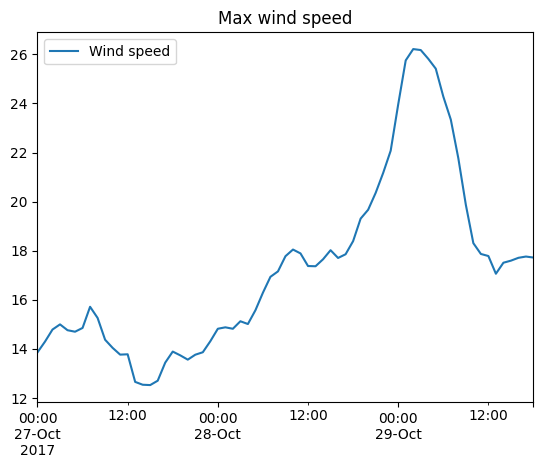
Dataset has other methods for calculating typical statistics, e.g. max, quantile…
ds[["Wind speed"]].max(axis="space").to_dataframe().plot(title="Max wind speed");
ds[["Wind speed"]].quantile(q=[0.1,0.5,0.9],axis="space").to_dataframe().plot();
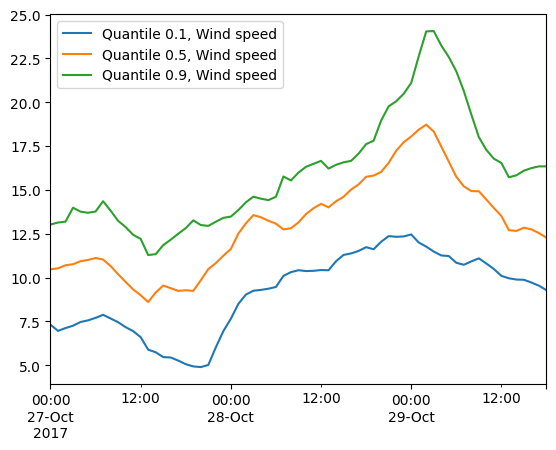
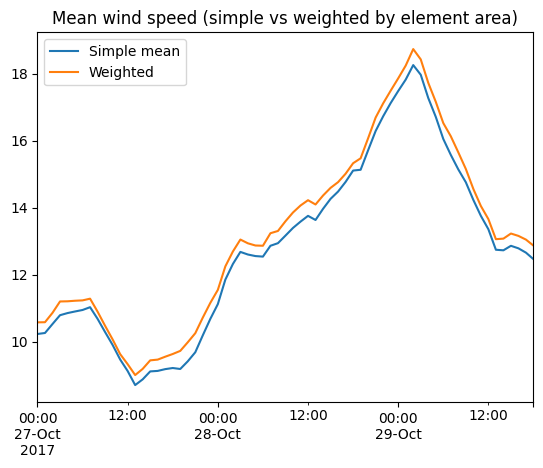
It’s important to know that the element area is not taking into account when doing the spatial aggregations! Only Dataset.average supports weighted averages.
df = ds[["Wind speed"]].mean(axis="space").to_dataframe()
df.columns = ["Simple mean"]
area=ds.geometry.get_element_area()
df['Weighted'] = ds[["Wind speed"]].average(axis="space", weights=area).to_dataframe()
df.plot(title="Mean wind speed (simple vs weighted by element area)");
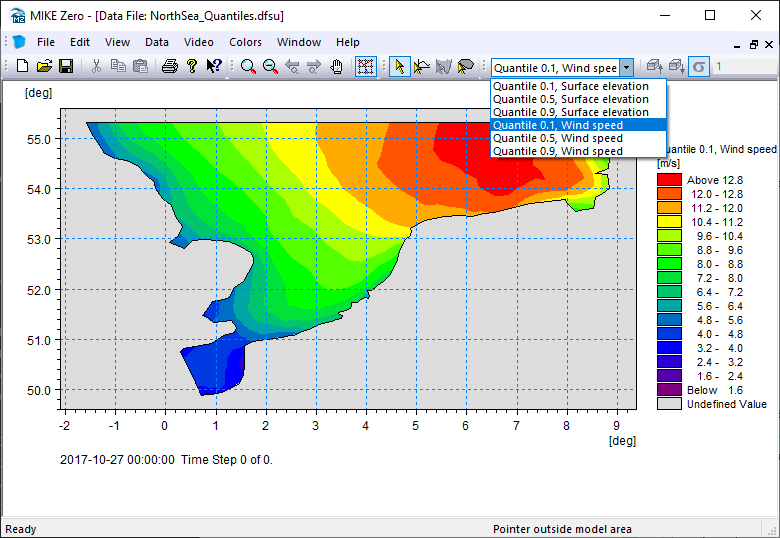
Quantiles to file#
dsq  = ds.quantile(q=[0.1,0.5,0.9])
dsq
<mikeio.Dataset>
dims: (element:958)
time: 2017-10-27 00:00:00 (time-invariant)
geometry: Dfsu2D (958 elements, 570 nodes)
items:
  0:  Quantile 0.1, Surface elevation <Surface Elevation> (meter)
  1:  Quantile 0.5, Surface elevation <Surface Elevation> (meter)
  2:  Quantile 0.9, Surface elevation <Surface Elevation> (meter)
  3:  Quantile 0.1, Wind speed <Wind speed> (meter per sec)
  4:  Quantile 0.5, Wind speed <Wind speed> (meter per sec)
  5:  Quantile 0.9, Wind speed <Wind speed> (meter per sec)
Write to a new dfsu file
dsq.to_dfs("NorthSea_Quantiles.dfsu")
Total#
Aggregating over all data (both time and space) can be done from the Dataset in a few ways:
ds.describe() - will give you summary statistics like pandas df.describe()
using axis=None in ds.mean(), ds.min()
using standard NumPy aggregation functions on the Dataset data e.g. ds[“Wind speed”].mean()
ds.describe()
| Surface elevation | Wind speed | |
|---|---|---|
| count | 64186.000000 | 64186.000000 |
| mean | 0.449857 | 12.772705 |
| std | 0.651157 | 3.694293 |
| min | -2.347003 | 1.190171 |
| 25% | 0.057831 | 10.376003 |
| 50% | 0.466257 | 12.653086 |
| 75% | 0.849586 | 14.885848 |
| max | 3.756879 | 26.213045 |
ds.min(axis=None).to_dataframe()
| Surface elevation | Wind speed | |
|---|---|---|
| 2017-10-27 | -2.347003 | 1.190171 |
ds["Wind speed"].values.min()
np.float32(1.1901706)
Generic#
The MIKEIO.generic submodule can produce common temporal statistics on any dfs file (of any size). The output will be a new dfs file. Currently, generic has these methods for calculating statistics:
avg_time()
quantile()
generic.avg_time("data/NorthSea_HD_and_windspeed.dfsu", "NorthSea_avg.dfsu")
0%| | 0/66 [00:00<?, ?it/s]
100%|██████████| 66/66 [00:00<00:00, 19767.50it/s]
ds = mikeio.read("NorthSea_avg.dfsu", items="Wind speed")
ds
<mikeio.Dataset>
dims: (time:1, element:958)
time: 2017-10-27 00:00:00 (time-invariant)
geometry: Dfsu2D (958 elements, 570 nodes)
items:
  0:  Wind speed <Wind speed> (meter per sec)
ds["Wind speed"].plot(title="Mean wind speed");
generic.quantile("data/NorthSea_HD_and_windspeed.dfsu", "NorthSea_Quantiles2.dfsu", q=[0.1, 0.5, 0.9])
Custom#
ds = mikeio.read("data/NorthSea_HD_and_windspeed.dfsu")
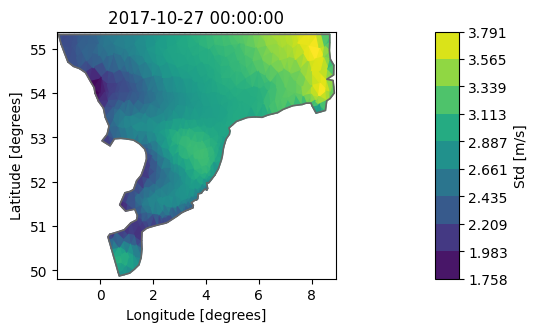
Dataset.aggregate#
With aggregate we can get Dataset statistics with our “own” function, e.g. standard deviation:
import numpy as np
dsa = ds.aggregate(func=np.std)
dsa["Wind speed"].plot(label="Std [m/s]");
Exceedance probability#
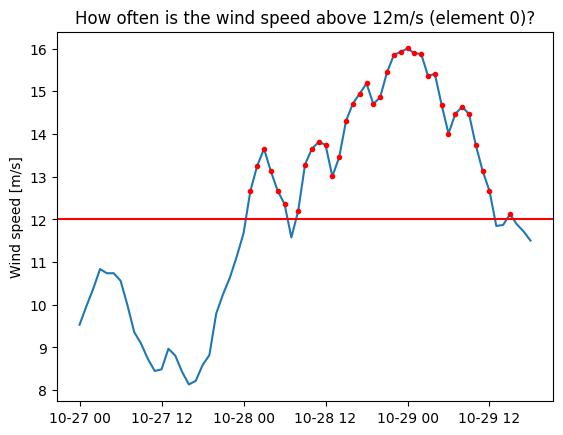
Let’s find out how often the wind exceeds 12m/s in our simulation.
import matplotlib.pyplot as plt
nt = ds.n_timesteps
one_to_zero = 1. - np.arange(1., nt + 1.)/nt
val = ds["Wind speed"].isel(element=0).values
plt.plot(ds.time, val);
plt.plot(ds.time[val>12], val[val>12],'.r');
plt.axhline(y=12,color='r')
plt.ylabel('Wind speed [m/s]')
plt.title('How often is the wind speed above 12m/s (element 0)?');
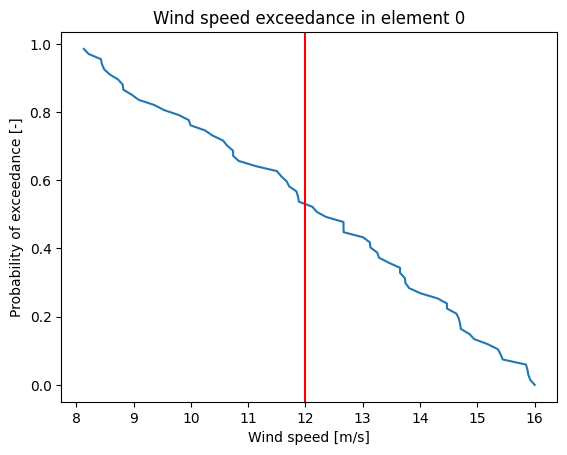
plt.plot(np.sort(val), one_to_zero);
plt.xlabel('Wind speed [m/s]')
plt.ylabel('Probability of exceedance [-]')
plt.axvline(x=12,color='r')
plt.title('Wind speed exceedance in element 0');
# Create empty DataArray
item=mikeio.ItemInfo(mikeio.EUMType.Probability)
data = np.full(shape=(1,ds.geometry.n_elements), fill_value=np.nan)
dae = mikeio.DataArray(data=data, time="2017-10-27", item=item, geometry=ds.geometry)
threshold = 12
for j in range(ds.n_elements):
    # this is a naive and slow way of calculating this!
    dat = ds["Wind speed"][:,j].values
    dae[0,j] = np.interp(threshold, np.sort(dat), one_to_zero)
---------------------------------------------------------------------------
AttributeError                            Traceback (most recent call last)
Cell In[27], line 2
      1 threshold = 12
----> 2 for j in range(ds.n_elements):
      3     # this is a naive and slow way of calculating this!
      4     dat = ds["Wind speed"][:,j].values
      5     dae[0,j] = np.interp(threshold, np.sort(dat), one_to_zero)

AttributeError: 'Dataset' object has no attribute 'n_elements'
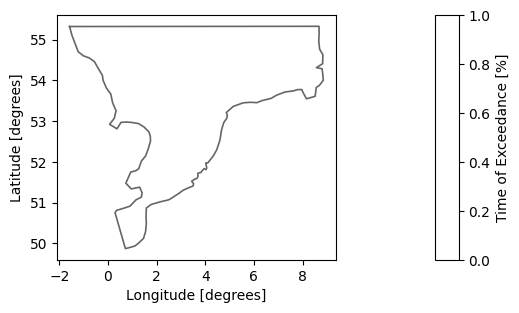
dae100 = dae*100
dae100.plot(title="Wind speed exceeding 12 m/s",
    label="Time of Exceedance [%]", cmap="YlOrRd");
/opt/hostedtoolcache/Python/3.13.12/x64/lib/python3.13/site-packages/mikeio/spatial/_FM_plot.py:298: RuntimeWarning: All-NaN slice encountered
  vmin = vmin or np.nanmin(z)
/opt/hostedtoolcache/Python/3.13.12/x64/lib/python3.13/site-packages/mikeio/spatial/_FM_plot.py:299: RuntimeWarning: All-NaN slice encountered
  vmax = vmax or np.nanmax(z)
---------------------------------------------------------------------------
ValueError                                Traceback (most recent call last)
Cell In[28], line 2
      1 dae100 = dae*100
----> 2 dae100.plot(title="Wind speed exceeding 12 m/s",
      3     label="Time of Exceedance [%]", cmap="YlOrRd");

File /opt/hostedtoolcache/Python/3.13.12/x64/lib/python3.13/site-packages/mikeio/dataset/_data_plot.py:450, in _DataArrayPlotterFM.__call__(self, ax, figsize, **kwargs)
    448 """Plot data as coloured patches."""
    449 ax = self._get_ax(ax, figsize)
--> 450 return self._plot_FM_map(ax, **kwargs)

File /opt/hostedtoolcache/Python/3.13.12/x64/lib/python3.13/site-packages/mikeio/dataset/_data_plot.py:565, in _DataArrayPlotterFM._plot_FM_map(self, ax, **kwargs)
    562 if "title" not in kwargs:
    563     kwargs["title"] = title
--> 565 return _plot_map(
    566     node_coordinates=geometry.node_coordinates,
    567     element_table=geometry.element_table,
    568     element_coordinates=geometry.element_coordinates,
    569     boundary_polylines=geometry.boundary_polygons.lines,
    570     projection=geometry.projection,
    571     z=values,
    572     ax=ax,
    573     **kwargs,
    574 )

File /opt/hostedtoolcache/Python/3.13.12/x64/lib/python3.13/site-packages/mikeio/spatial/_FM_plot.py:277, in _plot_map(node_coordinates, element_table, element_coordinates, boundary_polylines, projection, z, plot_type, title, label, cmap, vmin, vmax, levels, n_refinements, show_mesh, show_outline, figsize, ax, add_colorbar)
    274     __add_outline(ax, boundary_polylines)
    276 if add_colorbar:
--> 277     __add_colorbar(ax, cmap_ScMappable, fig_obj, label, levels, cbar_extend)
    279 __set_plot_limits(ax, nc)
    281 if title:

File /opt/hostedtoolcache/Python/3.13.12/x64/lib/python3.13/site-packages/mikeio/spatial/_FM_plot.py:424, in __add_colorbar(ax, cmap_ScMappable, fig_obj, label, levels, cbar_extend)
    421 cax = make_axes_locatable(ax).append_axes("right", size="5%", pad=0.05)
    422 cmap_sm = cmap_ScMappable if cmap_ScMappable else fig_obj
--> 424 plt.colorbar(
    425     cmap_sm,  # type: ignore
    426     label=label,
    427     cax=cax,
    428     ticks=levels,
    429     boundaries=levels,
    430     extend=cbar_extend,
    431 )

File /opt/hostedtoolcache/Python/3.13.12/x64/lib/python3.13/site-packages/matplotlib/pyplot.py:2533, in colorbar(mappable, cax, ax, **kwargs)
   2528     if mappable is None:
   2529         raise RuntimeError('No mappable was found to use for colorbar '
   2530                            'creation. First define a mappable such as '
   2531                            'an image (with imshow) or a contour set ('
   2532                            'with contourf).')
-> 2533 ret = gcf().colorbar(mappable, cax=cax, ax=ax, **kwargs)
   2534 return ret

File /opt/hostedtoolcache/Python/3.13.12/x64/lib/python3.13/site-packages/matplotlib/figure.py:1308, in FigureBase.colorbar(self, mappable, cax, ax, use_gridspec, **kwargs)
   1300         _api.warn_external(
   1301                 f'Adding colorbar to a different Figure '
   1302                 f'{repr(mappable_host_fig)} than '
   1303                 f'{repr(self._root_figure)} which '
   1304                 f'fig.colorbar is called on.')
   1306 NON_COLORBAR_KEYS = [  # remove kws that cannot be passed to Colorbar
   1307     'fraction', 'pad', 'shrink', 'aspect', 'anchor', 'panchor']
-> 1308 cb = cbar.Colorbar(cax, mappable, **{
   1309     k: v for k, v in kwargs.items() if k not in NON_COLORBAR_KEYS})
   1310 cax.get_figure(root=False).stale = True
   1311 return cb

File /opt/hostedtoolcache/Python/3.13.12/x64/lib/python3.13/site-packages/matplotlib/colorbar.py:387, in Colorbar.__init__(self, ax, mappable, alpha, location, extend, extendfrac, extendrect, ticks, format, values, boundaries, spacing, drawedges, label, cmap, norm, orientation, ticklocation)
    384 self.ticklocation = ticklocation
    386 self.set_label(label)
--> 387 self._reset_locator_formatter_scale()
    389 if np.iterable(ticks):
    390     self._locator = ticker.FixedLocator(ticks, nbins=len(ticks))

File /opt/hostedtoolcache/Python/3.13.12/x64/lib/python3.13/site-packages/matplotlib/colorbar.py:1163, in Colorbar._reset_locator_formatter_scale(self)
   1157 def _reset_locator_formatter_scale(self):
   1158     """
   1159     Reset the locator et al to defaults.  Any user-hardcoded changes
   1160     need to be re-entered if this gets called (either at init, or when
   1161     the mappable normal gets changed: Colorbar.update_normal)
   1162     """
-> 1163     self._process_values()
   1164     self._locator = None
   1165     self._minorlocator = None

File /opt/hostedtoolcache/Python/3.13.12/x64/lib/python3.13/site-packages/matplotlib/colorbar.py:1099, in Colorbar._process_values(self)
   1097     self.norm.vmin = 0
   1098     self.norm.vmax = 1
-> 1099 self.norm.vmin, self.norm.vmax = mtransforms.nonsingular(
   1100     self.norm.vmin, self.norm.vmax, expander=0.1)
   1101 if (not isinstance(self.norm, colors.BoundaryNorm) and
   1102         (self.boundaries is None)):
   1103     b = self.norm.inverse(b)

File /opt/hostedtoolcache/Python/3.13.12/x64/lib/python3.13/site-packages/matplotlib/colors.py:2184, in Normalize.vmin(self, value)
   2182 if value != self._vmin:
   2183     self._vmin = value
-> 2184     self._changed()

File /opt/hostedtoolcache/Python/3.13.12/x64/lib/python3.13/site-packages/matplotlib/colors.py:2212, in Normalize._changed(self)
   2207 def _changed(self):
   2208     """
   2209     Call this whenever the norm is changed to notify all the
   2210     callback listeners to the 'changed' signal.
   2211     """
-> 2212     self.callbacks.process('changed')

File /opt/hostedtoolcache/Python/3.13.12/x64/lib/python3.13/site-packages/matplotlib/cbook.py:366, in CallbackRegistry.process(self, s, *args, **kwargs)
    364 except Exception as exc:
    365     if self.exception_handler is not None:
--> 366         self.exception_handler(exc)
    367     else:
    368         raise

File /opt/hostedtoolcache/Python/3.13.12/x64/lib/python3.13/site-packages/matplotlib/cbook.py:110, in _exception_printer(exc)
    108 def _exception_printer(exc):
    109     if _get_running_interactive_framework() in ["headless", None]:
--> 110         raise exc
    111     else:
    112         traceback.print_exc()

File /opt/hostedtoolcache/Python/3.13.12/x64/lib/python3.13/site-packages/matplotlib/cbook.py:361, in CallbackRegistry.process(self, s, *args, **kwargs)
    359 if func is not None:
    360     try:
--> 361         func(*args, **kwargs)
    362     # this does not capture KeyboardInterrupt, SystemExit,
    363     # and GeneratorExit
    364     except Exception as exc:

File /opt/hostedtoolcache/Python/3.13.12/x64/lib/python3.13/site-packages/matplotlib/colorizer.py:297, in Colorizer.changed(self)
    292 def changed(self):
    293     """
    294     Call this whenever the mappable is changed to notify all the
    295     callbackSM listeners to the 'changed' signal.
    296     """
--> 297     self.callbacks.process('changed')
    298     self.stale = True

File /opt/hostedtoolcache/Python/3.13.12/x64/lib/python3.13/site-packages/matplotlib/cbook.py:366, in CallbackRegistry.process(self, s, *args, **kwargs)
    364 except Exception as exc:
    365     if self.exception_handler is not None:
--> 366         self.exception_handler(exc)
    367     else:
    368         raise

File /opt/hostedtoolcache/Python/3.13.12/x64/lib/python3.13/site-packages/matplotlib/cbook.py:110, in _exception_printer(exc)
    108 def _exception_printer(exc):
    109     if _get_running_interactive_framework() in ["headless", None]:
--> 110         raise exc
    111     else:
    112         traceback.print_exc()

File /opt/hostedtoolcache/Python/3.13.12/x64/lib/python3.13/site-packages/matplotlib/cbook.py:361, in CallbackRegistry.process(self, s, *args, **kwargs)
    359 if func is not None:
    360     try:
--> 361         func(*args, **kwargs)
    362     # this does not capture KeyboardInterrupt, SystemExit,
    363     # and GeneratorExit
    364     except Exception as exc:

File /opt/hostedtoolcache/Python/3.13.12/x64/lib/python3.13/site-packages/matplotlib/colorizer.py:589, in _ScalarMappable.changed(self)
    584 def changed(self):
    585     """
    586     Call this whenever the mappable is changed to notify all the
    587     callbackSM listeners to the 'changed' signal.
    588     """
--> 589     self.callbacks.process('changed', self)
    590     self.stale = True

File /opt/hostedtoolcache/Python/3.13.12/x64/lib/python3.13/site-packages/matplotlib/cbook.py:366, in CallbackRegistry.process(self, s, *args, **kwargs)
    364 except Exception as exc:
    365     if self.exception_handler is not None:
--> 366         self.exception_handler(exc)
    367     else:
    368         raise

File /opt/hostedtoolcache/Python/3.13.12/x64/lib/python3.13/site-packages/matplotlib/cbook.py:110, in _exception_printer(exc)
    108 def _exception_printer(exc):
    109     if _get_running_interactive_framework() in ["headless", None]:
--> 110         raise exc
    111     else:
    112         traceback.print_exc()

File /opt/hostedtoolcache/Python/3.13.12/x64/lib/python3.13/site-packages/matplotlib/cbook.py:361, in CallbackRegistry.process(self, s, *args, **kwargs)
    359 if func is not None:
    360     try:
--> 361         func(*args, **kwargs)
    362     # this does not capture KeyboardInterrupt, SystemExit,
    363     # and GeneratorExit
    364     except Exception as exc:

File /opt/hostedtoolcache/Python/3.13.12/x64/lib/python3.13/site-packages/matplotlib/colorbar.py:513, in Colorbar.update_normal(self, mappable)
    510     self.norm = self.mappable.norm
    511     self._reset_locator_formatter_scale()
--> 513 self._draw_all()
    514 if isinstance(self.mappable, contour.ContourSet):
    515     CS = self.mappable

File /opt/hostedtoolcache/Python/3.13.12/x64/lib/python3.13/site-packages/matplotlib/colorbar.py:540, in Colorbar._draw_all(self)
    534 self._short_axis().set_ticks([], minor=True)
    536 # Set self._boundaries and self._values, including extensions.
    537 # self._boundaries are the edges of each square of color, and
    538 # self._values are the value to map into the norm to get the
    539 # color:
--> 540 self._process_values()
    541 # Set self.vmin and self.vmax to first and last boundary, excluding
    542 # extensions:
    543 self.vmin, self.vmax = self._boundaries[self._inside][[0, -1]]

File /opt/hostedtoolcache/Python/3.13.12/x64/lib/python3.13/site-packages/matplotlib/colorbar.py:1099, in Colorbar._process_values(self)
   1097     self.norm.vmin = 0
   1098     self.norm.vmax = 1
-> 1099 self.norm.vmin, self.norm.vmax = mtransforms.nonsingular(
   1100     self.norm.vmin, self.norm.vmax, expander=0.1)
   1101 if (not isinstance(self.norm, colors.BoundaryNorm) and
   1102         (self.boundaries is None)):
   1103     b = self.norm.inverse(b)

File /opt/hostedtoolcache/Python/3.13.12/x64/lib/python3.13/site-packages/matplotlib/colors.py:2195, in Normalize.vmax(self, value)
   2193 if value != self._vmax:
   2194     self._vmax = value
-> 2195     self._changed()

File /opt/hostedtoolcache/Python/3.13.12/x64/lib/python3.13/site-packages/matplotlib/colors.py:2212, in Normalize._changed(self)
   2207 def _changed(self):
   2208     """
   2209     Call this whenever the norm is changed to notify all the
   2210     callback listeners to the 'changed' signal.
   2211     """
-> 2212     self.callbacks.process('changed')

File /opt/hostedtoolcache/Python/3.13.12/x64/lib/python3.13/site-packages/matplotlib/cbook.py:366, in CallbackRegistry.process(self, s, *args, **kwargs)
    364 except Exception as exc:
    365     if self.exception_handler is not None:
--> 366         self.exception_handler(exc)
    367     else:
    368         raise

File /opt/hostedtoolcache/Python/3.13.12/x64/lib/python3.13/site-packages/matplotlib/cbook.py:110, in _exception_printer(exc)
    108 def _exception_printer(exc):
    109     if _get_running_interactive_framework() in ["headless", None]:
--> 110         raise exc
    111     else:
    112         traceback.print_exc()

File /opt/hostedtoolcache/Python/3.13.12/x64/lib/python3.13/site-packages/matplotlib/cbook.py:361, in CallbackRegistry.process(self, s, *args, **kwargs)
    359 if func is not None:
    360     try:
--> 361         func(*args, **kwargs)
    362     # this does not capture KeyboardInterrupt, SystemExit,
    363     # and GeneratorExit
    364     except Exception as exc:

File /opt/hostedtoolcache/Python/3.13.12/x64/lib/python3.13/site-packages/matplotlib/colorizer.py:297, in Colorizer.changed(self)
    292 def changed(self):
    293     """
    294     Call this whenever the mappable is changed to notify all the
    295     callbackSM listeners to the 'changed' signal.
    296     """
--> 297     self.callbacks.process('changed')
    298     self.stale = True

File /opt/hostedtoolcache/Python/3.13.12/x64/lib/python3.13/site-packages/matplotlib/cbook.py:366, in CallbackRegistry.process(self, s, *args, **kwargs)
    364 except Exception as exc:
    365     if self.exception_handler is not None:
--> 366         self.exception_handler(exc)
    367     else:
    368         raise

File /opt/hostedtoolcache/Python/3.13.12/x64/lib/python3.13/site-packages/matplotlib/cbook.py:110, in _exception_printer(exc)
    108 def _exception_printer(exc):
    109     if _get_running_interactive_framework() in ["headless", None]:
--> 110         raise exc
    111     else:
    112         traceback.print_exc()

File /opt/hostedtoolcache/Python/3.13.12/x64/lib/python3.13/site-packages/matplotlib/cbook.py:361, in CallbackRegistry.process(self, s, *args, **kwargs)
    359 if func is not None:
    360     try:
--> 361         func(*args, **kwargs)
    362     # this does not capture KeyboardInterrupt, SystemExit,
    363     # and GeneratorExit
    364     except Exception as exc:

File /opt/hostedtoolcache/Python/3.13.12/x64/lib/python3.13/site-packages/matplotlib/colorizer.py:589, in _ScalarMappable.changed(self)
    584 def changed(self):
    585     """
    586     Call this whenever the mappable is changed to notify all the
    587     callbackSM listeners to the 'changed' signal.
    588     """
--> 589     self.callbacks.process('changed', self)
    590     self.stale = True

File /opt/hostedtoolcache/Python/3.13.12/x64/lib/python3.13/site-packages/matplotlib/cbook.py:366, in CallbackRegistry.process(self, s, *args, **kwargs)
    364 except Exception as exc:
    365     if self.exception_handler is not None:
--> 366         self.exception_handler(exc)
    367     else:
    368         raise

File /opt/hostedtoolcache/Python/3.13.12/x64/lib/python3.13/site-packages/matplotlib/cbook.py:110, in _exception_printer(exc)
    108 def _exception_printer(exc):
    109     if _get_running_interactive_framework() in ["headless", None]:
--> 110         raise exc
    111     else:
    112         traceback.print_exc()

File /opt/hostedtoolcache/Python/3.13.12/x64/lib/python3.13/site-packages/matplotlib/cbook.py:361, in CallbackRegistry.process(self, s, *args, **kwargs)
    359 if func is not None:
    360     try:
--> 361         func(*args, **kwargs)
    362     # this does not capture KeyboardInterrupt, SystemExit,
    363     # and GeneratorExit
    364     except Exception as exc:

File /opt/hostedtoolcache/Python/3.13.12/x64/lib/python3.13/site-packages/matplotlib/colorbar.py:513, in Colorbar.update_normal(self, mappable)
    510     self.norm = self.mappable.norm
    511     self._reset_locator_formatter_scale()
--> 513 self._draw_all()
    514 if isinstance(self.mappable, contour.ContourSet):
    515     CS = self.mappable

File /opt/hostedtoolcache/Python/3.13.12/x64/lib/python3.13/site-packages/matplotlib/colorbar.py:555, in Colorbar._draw_all(self)
    553 if self.orientation == 'vertical':
    554     self.ax.set_xlim(0, 1)
--> 555     self.ax.set_ylim(lower, upper)
    556 else:
    557     self.ax.set_ylim(0, 1)

File /opt/hostedtoolcache/Python/3.13.12/x64/lib/python3.13/site-packages/matplotlib/axes/_base.py:4062, in _AxesBase.set_ylim(self, bottom, top, emit, auto, ymin, ymax)
   4060         raise TypeError("Cannot pass both 'top' and 'ymax'")
   4061     top = ymax
-> 4062 return self.yaxis._set_lim(bottom, top, emit=emit, auto=auto)

File /opt/hostedtoolcache/Python/3.13.12/x64/lib/python3.13/site-packages/matplotlib/axis.py:1216, in Axis._set_lim(self, v0, v1, emit, auto)
   1213 name = self._get_axis_name()
   1215 self.axes._process_unit_info([(name, (v0, v1))], convert=False)
-> 1216 v0 = self.axes._validate_converted_limits(v0, self.convert_units)
   1217 v1 = self.axes._validate_converted_limits(v1, self.convert_units)
   1219 if v0 is None or v1 is None:
   1220     # Axes init calls set_xlim(0, 1) before get_xlim() can be called,
   1221     # so only grab the limits if we really need them.

File /opt/hostedtoolcache/Python/3.13.12/x64/lib/python3.13/site-packages/matplotlib/axes/_base.py:3749, in _AxesBase._validate_converted_limits(self, limit, convert)
   3746     converted_limit = converted_limit.squeeze()
   3747 if (isinstance(converted_limit, Real)
   3748         and not np.isfinite(converted_limit)):
-> 3749     raise ValueError("Axis limits cannot be NaN or Inf")
   3750 return converted_limit

ValueError: Axis limits cannot be NaN or Inf
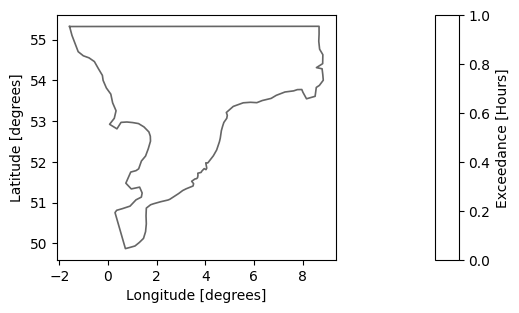
total_hours = (ds.time[-1]-ds.time[0]).total_seconds()/3600
dae_hours = dae*total_hours
dae_hours.plot(title="Wind speed exceeding 12 m/s",
    label="Exceedance [Hours]", cmap="YlOrRd");
---------------------------------------------------------------------------
ValueError                                Traceback (most recent call last)
Cell In[29], line 3
      1 total_hours = (ds.time[-1]-ds.time[0]).total_seconds()/3600
      2 dae_hours = dae*total_hours
----> 3 dae_hours.plot(title="Wind speed exceeding 12 m/s",
      4     label="Exceedance [Hours]", cmap="YlOrRd");

File /opt/hostedtoolcache/Python/3.13.12/x64/lib/python3.13/site-packages/mikeio/dataset/_data_plot.py:450, in _DataArrayPlotterFM.__call__(self, ax, figsize, **kwargs)
    448 """Plot data as coloured patches."""
    449 ax = self._get_ax(ax, figsize)
--> 450 return self._plot_FM_map(ax, **kwargs)

File /opt/hostedtoolcache/Python/3.13.12/x64/lib/python3.13/site-packages/mikeio/dataset/_data_plot.py:565, in _DataArrayPlotterFM._plot_FM_map(self, ax, **kwargs)
    562 if "title" not in kwargs:
    563     kwargs["title"] = title
--> 565 return _plot_map(
    566     node_coordinates=geometry.node_coordinates,
    567     element_table=geometry.element_table,
    568     element_coordinates=geometry.element_coordinates,
    569     boundary_polylines=geometry.boundary_polygons.lines,
    570     projection=geometry.projection,
    571     z=values,
    572     ax=ax,
    573     **kwargs,
    574 )

File /opt/hostedtoolcache/Python/3.13.12/x64/lib/python3.13/site-packages/mikeio/spatial/_FM_plot.py:277, in _plot_map(node_coordinates, element_table, element_coordinates, boundary_polylines, projection, z, plot_type, title, label, cmap, vmin, vmax, levels, n_refinements, show_mesh, show_outline, figsize, ax, add_colorbar)
    274     __add_outline(ax, boundary_polylines)
    276 if add_colorbar:
--> 277     __add_colorbar(ax, cmap_ScMappable, fig_obj, label, levels, cbar_extend)
    279 __set_plot_limits(ax, nc)
    281 if title:

File /opt/hostedtoolcache/Python/3.13.12/x64/lib/python3.13/site-packages/mikeio/spatial/_FM_plot.py:424, in __add_colorbar(ax, cmap_ScMappable, fig_obj, label, levels, cbar_extend)
    421 cax = make_axes_locatable(ax).append_axes("right", size="5%", pad=0.05)
    422 cmap_sm = cmap_ScMappable if cmap_ScMappable else fig_obj
--> 424 plt.colorbar(
    425     cmap_sm,  # type: ignore
    426     label=label,
    427     cax=cax,
    428     ticks=levels,
    429     boundaries=levels,
    430     extend=cbar_extend,
    431 )

File /opt/hostedtoolcache/Python/3.13.12/x64/lib/python3.13/site-packages/matplotlib/pyplot.py:2533, in colorbar(mappable, cax, ax, **kwargs)
   2528     if mappable is None:
   2529         raise RuntimeError('No mappable was found to use for colorbar '
   2530                            'creation. First define a mappable such as '
   2531                            'an image (with imshow) or a contour set ('
   2532                            'with contourf).')
-> 2533 ret = gcf().colorbar(mappable, cax=cax, ax=ax, **kwargs)
   2534 return ret

File /opt/hostedtoolcache/Python/3.13.12/x64/lib/python3.13/site-packages/matplotlib/figure.py:1308, in FigureBase.colorbar(self, mappable, cax, ax, use_gridspec, **kwargs)
   1300         _api.warn_external(
   1301                 f'Adding colorbar to a different Figure '
   1302                 f'{repr(mappable_host_fig)} than '
   1303                 f'{repr(self._root_figure)} which '
   1304                 f'fig.colorbar is called on.')
   1306 NON_COLORBAR_KEYS = [  # remove kws that cannot be passed to Colorbar
   1307     'fraction', 'pad', 'shrink', 'aspect', 'anchor', 'panchor']
-> 1308 cb = cbar.Colorbar(cax, mappable, **{
   1309     k: v for k, v in kwargs.items() if k not in NON_COLORBAR_KEYS})
   1310 cax.get_figure(root=False).stale = True
   1311 return cb

File /opt/hostedtoolcache/Python/3.13.12/x64/lib/python3.13/site-packages/matplotlib/colorbar.py:387, in Colorbar.__init__(self, ax, mappable, alpha, location, extend, extendfrac, extendrect, ticks, format, values, boundaries, spacing, drawedges, label, cmap, norm, orientation, ticklocation)
    384 self.ticklocation = ticklocation
    386 self.set_label(label)
--> 387 self._reset_locator_formatter_scale()
    389 if np.iterable(ticks):
    390     self._locator = ticker.FixedLocator(ticks, nbins=len(ticks))

File /opt/hostedtoolcache/Python/3.13.12/x64/lib/python3.13/site-packages/matplotlib/colorbar.py:1163, in Colorbar._reset_locator_formatter_scale(self)
   1157 def _reset_locator_formatter_scale(self):
   1158     """
   1159     Reset the locator et al to defaults.  Any user-hardcoded changes
   1160     need to be re-entered if this gets called (either at init, or when
   1161     the mappable normal gets changed: Colorbar.update_normal)
   1162     """
-> 1163     self._process_values()
   1164     self._locator = None
   1165     self._minorlocator = None

File /opt/hostedtoolcache/Python/3.13.12/x64/lib/python3.13/site-packages/matplotlib/colorbar.py:1099, in Colorbar._process_values(self)
   1097     self.norm.vmin = 0
   1098     self.norm.vmax = 1
-> 1099 self.norm.vmin, self.norm.vmax = mtransforms.nonsingular(
   1100     self.norm.vmin, self.norm.vmax, expander=0.1)
   1101 if (not isinstance(self.norm, colors.BoundaryNorm) and
   1102         (self.boundaries is None)):
   1103     b = self.norm.inverse(b)

File /opt/hostedtoolcache/Python/3.13.12/x64/lib/python3.13/site-packages/matplotlib/colors.py:2184, in Normalize.vmin(self, value)
   2182 if value != self._vmin:
   2183     self._vmin = value
-> 2184     self._changed()

File /opt/hostedtoolcache/Python/3.13.12/x64/lib/python3.13/site-packages/matplotlib/colors.py:2212, in Normalize._changed(self)
   2207 def _changed(self):
   2208     """
   2209     Call this whenever the norm is changed to notify all the
   2210     callback listeners to the 'changed' signal.
   2211     """
-> 2212     self.callbacks.process('changed')

File /opt/hostedtoolcache/Python/3.13.12/x64/lib/python3.13/site-packages/matplotlib/cbook.py:366, in CallbackRegistry.process(self, s, *args, **kwargs)
    364 except Exception as exc:
    365     if self.exception_handler is not None:
--> 366         self.exception_handler(exc)
    367     else:
    368         raise

File /opt/hostedtoolcache/Python/3.13.12/x64/lib/python3.13/site-packages/matplotlib/cbook.py:110, in _exception_printer(exc)
    108 def _exception_printer(exc):
    109     if _get_running_interactive_framework() in ["headless", None]:
--> 110         raise exc
    111     else:
    112         traceback.print_exc()

File /opt/hostedtoolcache/Python/3.13.12/x64/lib/python3.13/site-packages/matplotlib/cbook.py:361, in CallbackRegistry.process(self, s, *args, **kwargs)
    359 if func is not None:
    360     try:
--> 361         func(*args, **kwargs)
    362     # this does not capture KeyboardInterrupt, SystemExit,
    363     # and GeneratorExit
    364     except Exception as exc:

File /opt/hostedtoolcache/Python/3.13.12/x64/lib/python3.13/site-packages/matplotlib/colorizer.py:297, in Colorizer.changed(self)
    292 def changed(self):
    293     """
    294     Call this whenever the mappable is changed to notify all the
    295     callbackSM listeners to the 'changed' signal.
    296     """
--> 297     self.callbacks.process('changed')
    298     self.stale = True

File /opt/hostedtoolcache/Python/3.13.12/x64/lib/python3.13/site-packages/matplotlib/cbook.py:366, in CallbackRegistry.process(self, s, *args, **kwargs)
    364 except Exception as exc:
    365     if self.exception_handler is not None:
--> 366         self.exception_handler(exc)
    367     else:
    368         raise

File /opt/hostedtoolcache/Python/3.13.12/x64/lib/python3.13/site-packages/matplotlib/cbook.py:110, in _exception_printer(exc)
    108 def _exception_printer(exc):
    109     if _get_running_interactive_framework() in ["headless", None]:
--> 110         raise exc
    111     else:
    112         traceback.print_exc()

File /opt/hostedtoolcache/Python/3.13.12/x64/lib/python3.13/site-packages/matplotlib/cbook.py:361, in CallbackRegistry.process(self, s, *args, **kwargs)
    359 if func is not None:
    360     try:
--> 361         func(*args, **kwargs)
    362     # this does not capture KeyboardInterrupt, SystemExit,
    363     # and GeneratorExit
    364     except Exception as exc:

File /opt/hostedtoolcache/Python/3.13.12/x64/lib/python3.13/site-packages/matplotlib/colorizer.py:589, in _ScalarMappable.changed(self)
    584 def changed(self):
    585     """
    586     Call this whenever the mappable is changed to notify all the
    587     callbackSM listeners to the 'changed' signal.
    588     """
--> 589     self.callbacks.process('changed', self)
    590     self.stale = True

File /opt/hostedtoolcache/Python/3.13.12/x64/lib/python3.13/site-packages/matplotlib/cbook.py:366, in CallbackRegistry.process(self, s, *args, **kwargs)
    364 except Exception as exc:
    365     if self.exception_handler is not None:
--> 366         self.exception_handler(exc)
    367     else:
    368         raise

File /opt/hostedtoolcache/Python/3.13.12/x64/lib/python3.13/site-packages/matplotlib/cbook.py:110, in _exception_printer(exc)
    108 def _exception_printer(exc):
    109     if _get_running_interactive_framework() in ["headless", None]:
--> 110         raise exc
    111     else:
    112         traceback.print_exc()

File /opt/hostedtoolcache/Python/3.13.12/x64/lib/python3.13/site-packages/matplotlib/cbook.py:361, in CallbackRegistry.process(self, s, *args, **kwargs)
    359 if func is not None:
    360     try:
--> 361         func(*args, **kwargs)
    362     # this does not capture KeyboardInterrupt, SystemExit,
    363     # and GeneratorExit
    364     except Exception as exc:

File /opt/hostedtoolcache/Python/3.13.12/x64/lib/python3.13/site-packages/matplotlib/colorbar.py:513, in Colorbar.update_normal(self, mappable)
    510     self.norm = self.mappable.norm
    511     self._reset_locator_formatter_scale()
--> 513 self._draw_all()
    514 if isinstance(self.mappable, contour.ContourSet):
    515     CS = self.mappable

File /opt/hostedtoolcache/Python/3.13.12/x64/lib/python3.13/site-packages/matplotlib/colorbar.py:540, in Colorbar._draw_all(self)
    534 self._short_axis().set_ticks([], minor=True)
    536 # Set self._boundaries and self._values, including extensions.
    537 # self._boundaries are the edges of each square of color, and
    538 # self._values are the value to map into the norm to get the
    539 # color:
--> 540 self._process_values()
    541 # Set self.vmin and self.vmax to first and last boundary, excluding
    542 # extensions:
    543 self.vmin, self.vmax = self._boundaries[self._inside][[0, -1]]

File /opt/hostedtoolcache/Python/3.13.12/x64/lib/python3.13/site-packages/matplotlib/colorbar.py:1099, in Colorbar._process_values(self)
   1097     self.norm.vmin = 0
   1098     self.norm.vmax = 1
-> 1099 self.norm.vmin, self.norm.vmax = mtransforms.nonsingular(
   1100     self.norm.vmin, self.norm.vmax, expander=0.1)
   1101 if (not isinstance(self.norm, colors.BoundaryNorm) and
   1102         (self.boundaries is None)):
   1103     b = self.norm.inverse(b)

File /opt/hostedtoolcache/Python/3.13.12/x64/lib/python3.13/site-packages/matplotlib/colors.py:2195, in Normalize.vmax(self, value)
   2193 if value != self._vmax:
   2194     self._vmax = value
-> 2195     self._changed()

File /opt/hostedtoolcache/Python/3.13.12/x64/lib/python3.13/site-packages/matplotlib/colors.py:2212, in Normalize._changed(self)
   2207 def _changed(self):
   2208     """
   2209     Call this whenever the norm is changed to notify all the
   2210     callback listeners to the 'changed' signal.
   2211     """
-> 2212     self.callbacks.process('changed')

File /opt/hostedtoolcache/Python/3.13.12/x64/lib/python3.13/site-packages/matplotlib/cbook.py:366, in CallbackRegistry.process(self, s, *args, **kwargs)
    364 except Exception as exc:
    365     if self.exception_handler is not None:
--> 366         self.exception_handler(exc)
    367     else:
    368         raise

File /opt/hostedtoolcache/Python/3.13.12/x64/lib/python3.13/site-packages/matplotlib/cbook.py:110, in _exception_printer(exc)
    108 def _exception_printer(exc):
    109     if _get_running_interactive_framework() in ["headless", None]:
--> 110         raise exc
    111     else:
    112         traceback.print_exc()

File /opt/hostedtoolcache/Python/3.13.12/x64/lib/python3.13/site-packages/matplotlib/cbook.py:361, in CallbackRegistry.process(self, s, *args, **kwargs)
    359 if func is not None:
    360     try:
--> 361         func(*args, **kwargs)
    362     # this does not capture KeyboardInterrupt, SystemExit,
    363     # and GeneratorExit
    364     except Exception as exc:

File /opt/hostedtoolcache/Python/3.13.12/x64/lib/python3.13/site-packages/matplotlib/colorizer.py:297, in Colorizer.changed(self)
    292 def changed(self):
    293     """
    294     Call this whenever the mappable is changed to notify all the
    295     callbackSM listeners to the 'changed' signal.
    296     """
--> 297     self.callbacks.process('changed')
    298     self.stale = True

File /opt/hostedtoolcache/Python/3.13.12/x64/lib/python3.13/site-packages/matplotlib/cbook.py:366, in CallbackRegistry.process(self, s, *args, **kwargs)
    364 except Exception as exc:
    365     if self.exception_handler is not None:
--> 366         self.exception_handler(exc)
    367     else:
    368         raise

File /opt/hostedtoolcache/Python/3.13.12/x64/lib/python3.13/site-packages/matplotlib/cbook.py:110, in _exception_printer(exc)
    108 def _exception_printer(exc):
    109     if _get_running_interactive_framework() in ["headless", None]:
--> 110         raise exc
    111     else:
    112         traceback.print_exc()

File /opt/hostedtoolcache/Python/3.13.12/x64/lib/python3.13/site-packages/matplotlib/cbook.py:361, in CallbackRegistry.process(self, s, *args, **kwargs)
    359 if func is not None:
    360     try:
--> 361         func(*args, **kwargs)
    362     # this does not capture KeyboardInterrupt, SystemExit,
    363     # and GeneratorExit
    364     except Exception as exc:

File /opt/hostedtoolcache/Python/3.13.12/x64/lib/python3.13/site-packages/matplotlib/colorizer.py:589, in _ScalarMappable.changed(self)
    584 def changed(self):
    585     """
    586     Call this whenever the mappable is changed to notify all the
    587     callbackSM listeners to the 'changed' signal.
    588     """
--> 589     self.callbacks.process('changed', self)
    590     self.stale = True

File /opt/hostedtoolcache/Python/3.13.12/x64/lib/python3.13/site-packages/matplotlib/cbook.py:366, in CallbackRegistry.process(self, s, *args, **kwargs)
    364 except Exception as exc:
    365     if self.exception_handler is not None:
--> 366         self.exception_handler(exc)
    367     else:
    368         raise

File /opt/hostedtoolcache/Python/3.13.12/x64/lib/python3.13/site-packages/matplotlib/cbook.py:110, in _exception_printer(exc)
    108 def _exception_printer(exc):
    109     if _get_running_interactive_framework() in ["headless", None]:
--> 110         raise exc
    111     else:
    112         traceback.print_exc()

File /opt/hostedtoolcache/Python/3.13.12/x64/lib/python3.13/site-packages/matplotlib/cbook.py:361, in CallbackRegistry.process(self, s, *args, **kwargs)
    359 if func is not None:
    360     try:
--> 361         func(*args, **kwargs)
    362     # this does not capture KeyboardInterrupt, SystemExit,
    363     # and GeneratorExit
    364     except Exception as exc:

File /opt/hostedtoolcache/Python/3.13.12/x64/lib/python3.13/site-packages/matplotlib/colorbar.py:513, in Colorbar.update_normal(self, mappable)
    510     self.norm = self.mappable.norm
    511     self._reset_locator_formatter_scale()
--> 513 self._draw_all()
    514 if isinstance(self.mappable, contour.ContourSet):
    515     CS = self.mappable

File /opt/hostedtoolcache/Python/3.13.12/x64/lib/python3.13/site-packages/matplotlib/colorbar.py:555, in Colorbar._draw_all(self)
    553 if self.orientation == 'vertical':
    554     self.ax.set_xlim(0, 1)
--> 555     self.ax.set_ylim(lower, upper)
    556 else:
    557     self.ax.set_ylim(0, 1)

File /opt/hostedtoolcache/Python/3.13.12/x64/lib/python3.13/site-packages/matplotlib/axes/_base.py:4062, in _AxesBase.set_ylim(self, bottom, top, emit, auto, ymin, ymax)
   4060         raise TypeError("Cannot pass both 'top' and 'ymax'")
   4061     top = ymax
-> 4062 return self.yaxis._set_lim(bottom, top, emit=emit, auto=auto)

File /opt/hostedtoolcache/Python/3.13.12/x64/lib/python3.13/site-packages/matplotlib/axis.py:1216, in Axis._set_lim(self, v0, v1, emit, auto)
   1213 name = self._get_axis_name()
   1215 self.axes._process_unit_info([(name, (v0, v1))], convert=False)
-> 1216 v0 = self.axes._validate_converted_limits(v0, self.convert_units)
   1217 v1 = self.axes._validate_converted_limits(v1, self.convert_units)
   1219 if v0 is None or v1 is None:
   1220     # Axes init calls set_xlim(0, 1) before get_xlim() can be called,
   1221     # so only grab the limits if we really need them.

File /opt/hostedtoolcache/Python/3.13.12/x64/lib/python3.13/site-packages/matplotlib/axes/_base.py:3749, in _AxesBase._validate_converted_limits(self, limit, convert)
   3746     converted_limit = converted_limit.squeeze()
   3747 if (isinstance(converted_limit, Real)
   3748         and not np.isfinite(converted_limit)):
-> 3749     raise ValueError("Axis limits cannot be NaN or Inf")
   3750 return converted_limit

ValueError: Axis limits cannot be NaN or Inf