Model skill assessment#
Simple comparison#
Sometimes all your need is a simple comparison of two time series. The modelskill.compare() method does just that.
import mikeio
import modelskill as ms
The model#
Can be either a dfs0 or a DataFrame.
fn_mod = 'data/SW/ts_storm_4.dfs0'
df_mod = mikeio.read(fn_mod, items=0).to_dataframe()
The observation#
Can be either a dfs0, a DataFrame or a PointObservation object.
fn_obs = 'data/SW/eur_Hm0.dfs0'
Match observation to model#
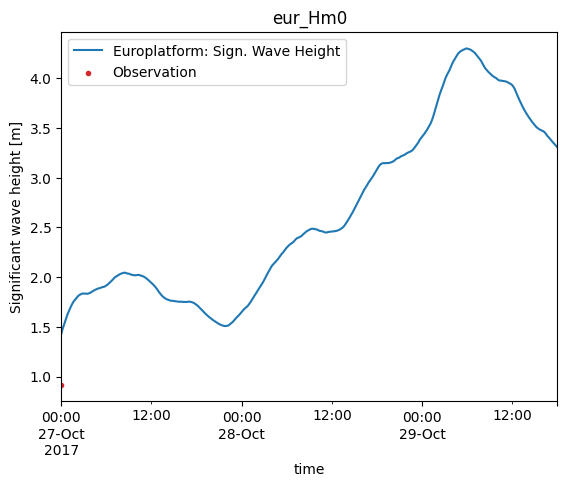
The match() method will return an object that can be used for scatter plots, skill assessment, time series plots etc.
cmp = ms.match(fn_obs, df_mod)
/opt/hostedtoolcache/Python/3.13.12/x64/lib/python3.13/site-packages/modelskill/obs.py:79: UserWarning: Could not guess geometry type from data or args, assuming POINT geometry. Use PointObservation or TrackObservation to be explicit.
  warnings.warn(
cmp.plot.timeseries();
Systematic vs random errors#
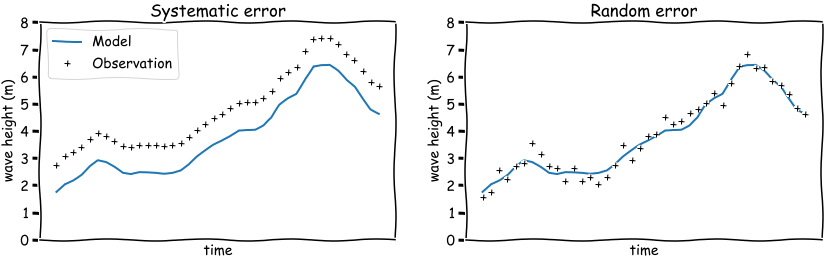
A model is an simplified version of a natural system, such as the ocean, and as such does not reflect every detail of the natural system.
In order to validate if a model does capture the essential dynamics of the natural system, it can be helpful to classify the mismatch of the model and observations in two broad categories:
systematic errors
random errors
A quantitativate assesment of a model involves calculating one or more model score, skill metrics, which in varying degrees capture systematic errors, random errors or a combination.
Metrics#
Bias is an indication of systematic error. In the left figure above, the model has negative bias (modelled wave heights are lower thatn observed). Thus it is an indication that the model can be improved.
Root Mean Square Error (rmse) is a combination of systematic and random error. It is a common metric to indicate the quality of a calibrated model, but less useful to understand the potential for further calibration since it captures both systematic and random errors.
Unbiased Root Mean Square Error (urmse) is the unbiased version of Root Mean Square Error. Since the bias is removed, it only captures the random error.
For a complete list of possible metrics, see the Metrics section in the ModelSkill docs.
To get a quantitative model skill, we use the .skill() method, which returns a table (similar to a DataFrame).
cmp.skill()
/opt/hostedtoolcache/Python/3.13.12/x64/lib/python3.13/site-packages/modelskill/metrics.py:344: RuntimeWarning: divide by zero encountered in scalar divide
  return 1 - SSr / SSt
| n | bias | rmse | urmse | mae | cc | si | r2 | |
|---|---|---|---|---|---|---|---|---|
| observation | ||||||||
| eur_Hm0 | 1 | 0.510124 | 0.510124 | 0.0 | 0.510124 | NaN | 0.0 | -inf |
The default is a number of common metrics, but you are free to pick your favorite metrics.
cmp.skill(metrics=["mae","rho","lin_slope"])
/opt/hostedtoolcache/Python/3.13.12/x64/lib/python3.13/site-packages/modelskill/metrics.py:736: SmallSampleWarning: One or more sample arguments is too small; all returned values will be NaN. See documentation for sample size requirements.
  reg = _linregress(obs, model)
| n | mae | rho | lin_slope | |
|---|---|---|---|---|
| observation | ||||
| eur_Hm0 | 1 | 0.510124 | NaN | NaN |
A very common way to visualize model skill is to use a scatter plot.
The scatter plot includes some additional features such as a 2d histogram, a Q-Q line and a regression line, but the appearance is highly configurable.
cmp.plot.scatter();
---------------------------------------------------------------------------
ValueError                                Traceback (most recent call last)
Cell In[8], line 1
----> 1 cmp.plot.scatter();

File /opt/hostedtoolcache/Python/3.13.12/x64/lib/python3.13/site-packages/modelskill/comparison/_comparer_plotter.py:565, in ComparerPlotter.scatter(self, model, bins, quantiles, fit_to_quantiles, show_points, show_hist, show_density, norm, backend, figsize, xlim, ylim, reg_method, title, xlabel, ylabel, skill_table, ax, **kwargs)
    563 axes = []
    564 for mod_name in mod_names:
--> 565     ax_mod = self._scatter_one_model(
    566         mod_name=mod_name,
    567         bins=bins,
    568         quantiles=quantiles,
    569         fit_to_quantiles=fit_to_quantiles,
    570         show_points=show_points,
    571         show_hist=show_hist,
    572         show_density=show_density,
    573         norm=norm,
    574         backend=backend,
    575         figsize=figsize,
    576         xlim=xlim,
    577         ylim=ylim,
    578         reg_method=reg_method,
    579         title=title,
    580         xlabel=xlabel,
    581         ylabel=ylabel,
    582         skill_table=skill_table,
    583         ax=ax,
    584         **kwargs,
    585     )
    586     axes.append(ax_mod)
    587 return axes[0] if len(axes) == 1 else axes

File /opt/hostedtoolcache/Python/3.13.12/x64/lib/python3.13/site-packages/modelskill/comparison/_comparer_plotter.py:649, in ComparerPlotter._scatter_one_model(self, mod_name, bins, quantiles, fit_to_quantiles, show_points, show_hist, show_density, norm, backend, figsize, xlim, ylim, reg_method, title, xlabel, ylabel, skill_table, **kwargs)
    645     reg_method = False
    647 skill_scores = skill.iloc[0].to_dict() if skill is not None else None
--> 649 ax = scatter(
    650     x=x,
    651     y=y,
    652     bins=bins,
    653     quantiles=quantiles,
    654     fit_to_quantiles=fit_to_quantiles,
    655     show_points=show_points,
    656     show_hist=show_hist,
    657     show_density=show_density,
    658     norm=norm,
    659     backend=backend,
    660     figsize=figsize,
    661     xlim=xlim,
    662     ylim=ylim,
    663     reg_method=reg_method,
    664     title=title,
    665     xlabel=xlabel,
    666     ylabel=ylabel,
    667     skill_scores=skill_scores,
    668     skill_score_unit=skill_score_unit,
    669     **kwargs,
    670 )
    672 if backend == "matplotlib" and self.is_directional:
    673     _xtick_directional(ax, xlim)

File /opt/hostedtoolcache/Python/3.13.12/x64/lib/python3.13/site-packages/modelskill/plotting/_scatter.py:228, in scatter(x, y, bins, quantiles, fit_to_quantiles, show_points, show_hist, show_density, norm, backend, figsize, xlim, ylim, reg_method, title, xlabel, ylabel, skill_table, skill_scores, skill_score_unit, ax, **kwargs)
    225     skill = cmp.skill(metrics=metrics)
    226     skill_scores = skill.to_dict("records")[0]
--> 228 return PLOTTING_BACKENDS[backend](
    229     x=x,
    230     y=y,
    231     x_sample=x_sample,
    232     y_sample=y_sample,
    233     z=z,
    234     xq=xq,
    235     yq=yq,
    236     x_trend=x_trend,
    237     show_density=show_density,
    238     norm=norm,
    239     show_points=show_points,
    240     show_hist=show_hist,
    241     nbins_hist=nbins_hist,
    242     reg_method=reg_method,
    243     xlabel=xlabel,
    244     ylabel=ylabel,
    245     figsize=figsize,
    246     xlim=xlim,
    247     ylim=ylim,
    248     title=title,
    249     skill_scores=skill_scores,
    250     skill_score_unit=skill_score_unit,
    251     fit_to_quantiles=fit_to_quantiles,
    252     ax=ax,
    253     **kwargs,
    254 )

File /opt/hostedtoolcache/Python/3.13.12/x64/lib/python3.13/site-packages/modelskill/plotting/_scatter.py:289, in _scatter_matplotlib(x, y, x_sample, y_sample, z, xq, yq, x_trend, show_density, show_points, show_hist, norm, nbins_hist, reg_method, xlabel, ylabel, figsize, xlim, ylim, title, skill_scores, skill_score_unit, fit_to_quantiles, ax, cmap, **kwargs)
    286 fig, ax = _get_fig_ax(ax, figsize)
    288 if len(x) < 2:
--> 289     raise ValueError("Not enough data to plot. At least 2 points are required.")
    291 ax.plot(
    292     [xlim[0], xlim[1]],
    293     [xlim[0], xlim[1]],
   (...)    296     zorder=3,
    297 )
    299 if show_points is None or show_points:

ValueError: Not enough data to plot. At least 2 points are required.
cmp.plot.scatter(binsize=0.5,
          show_points=False,
          xlim=[0,6], ylim=[0,6],
          title="A calibrated model!");
---------------------------------------------------------------------------
ValueError                                Traceback (most recent call last)
Cell In[9], line 1
----> 1 cmp.plot.scatter(binsize=0.5,
      2           show_points=False,
      3           xlim=[0,6], ylim=[0,6],
      4           title="A calibrated model!");

File /opt/hostedtoolcache/Python/3.13.12/x64/lib/python3.13/site-packages/modelskill/comparison/_comparer_plotter.py:565, in ComparerPlotter.scatter(self, model, bins, quantiles, fit_to_quantiles, show_points, show_hist, show_density, norm, backend, figsize, xlim, ylim, reg_method, title, xlabel, ylabel, skill_table, ax, **kwargs)
    563 axes = []
    564 for mod_name in mod_names:
--> 565     ax_mod = self._scatter_one_model(
    566         mod_name=mod_name,
    567         bins=bins,
    568         quantiles=quantiles,
    569         fit_to_quantiles=fit_to_quantiles,
    570         show_points=show_points,
    571         show_hist=show_hist,
    572         show_density=show_density,
    573         norm=norm,
    574         backend=backend,
    575         figsize=figsize,
    576         xlim=xlim,
    577         ylim=ylim,
    578         reg_method=reg_method,
    579         title=title,
    580         xlabel=xlabel,
    581         ylabel=ylabel,
    582         skill_table=skill_table,
    583         ax=ax,
    584         **kwargs,
    585     )
    586     axes.append(ax_mod)
    587 return axes[0] if len(axes) == 1 else axes

File /opt/hostedtoolcache/Python/3.13.12/x64/lib/python3.13/site-packages/modelskill/comparison/_comparer_plotter.py:649, in ComparerPlotter._scatter_one_model(self, mod_name, bins, quantiles, fit_to_quantiles, show_points, show_hist, show_density, norm, backend, figsize, xlim, ylim, reg_method, title, xlabel, ylabel, skill_table, **kwargs)
    645     reg_method = False
    647 skill_scores = skill.iloc[0].to_dict() if skill is not None else None
--> 649 ax = scatter(
    650     x=x,
    651     y=y,
    652     bins=bins,
    653     quantiles=quantiles,
    654     fit_to_quantiles=fit_to_quantiles,
    655     show_points=show_points,
    656     show_hist=show_hist,
    657     show_density=show_density,
    658     norm=norm,
    659     backend=backend,
    660     figsize=figsize,
    661     xlim=xlim,
    662     ylim=ylim,
    663     reg_method=reg_method,
    664     title=title,
    665     xlabel=xlabel,
    666     ylabel=ylabel,
    667     skill_scores=skill_scores,
    668     skill_score_unit=skill_score_unit,
    669     **kwargs,
    670 )
    672 if backend == "matplotlib" and self.is_directional:
    673     _xtick_directional(ax, xlim)

File /opt/hostedtoolcache/Python/3.13.12/x64/lib/python3.13/site-packages/modelskill/plotting/_scatter.py:228, in scatter(x, y, bins, quantiles, fit_to_quantiles, show_points, show_hist, show_density, norm, backend, figsize, xlim, ylim, reg_method, title, xlabel, ylabel, skill_table, skill_scores, skill_score_unit, ax, **kwargs)
    225     skill = cmp.skill(metrics=metrics)
    226     skill_scores = skill.to_dict("records")[0]
--> 228 return PLOTTING_BACKENDS[backend](
    229     x=x,
    230     y=y,
    231     x_sample=x_sample,
    232     y_sample=y_sample,
    233     z=z,
    234     xq=xq,
    235     yq=yq,
    236     x_trend=x_trend,
    237     show_density=show_density,
    238     norm=norm,
    239     show_points=show_points,
    240     show_hist=show_hist,
    241     nbins_hist=nbins_hist,
    242     reg_method=reg_method,
    243     xlabel=xlabel,
    244     ylabel=ylabel,
    245     figsize=figsize,
    246     xlim=xlim,
    247     ylim=ylim,
    248     title=title,
    249     skill_scores=skill_scores,
    250     skill_score_unit=skill_score_unit,
    251     fit_to_quantiles=fit_to_quantiles,
    252     ax=ax,
    253     **kwargs,
    254 )

File /opt/hostedtoolcache/Python/3.13.12/x64/lib/python3.13/site-packages/modelskill/plotting/_scatter.py:289, in _scatter_matplotlib(x, y, x_sample, y_sample, z, xq, yq, x_trend, show_density, show_points, show_hist, norm, nbins_hist, reg_method, xlabel, ylabel, figsize, xlim, ylim, title, skill_scores, skill_score_unit, fit_to_quantiles, ax, cmap, **kwargs)
    286 fig, ax = _get_fig_ax(ax, figsize)
    288 if len(x) < 2:
--> 289     raise ValueError("Not enough data to plot. At least 2 points are required.")
    291 ax.plot(
    292     [xlim[0], xlim[1]],
    293     [xlim[0], xlim[1]],
   (...)    296     zorder=3,
    297 )
    299 if show_points is None or show_points:

ValueError: Not enough data to plot. At least 2 points are required.
Taylor diagram#
A taylor diagram is a way to combine several statistics in a single plot, and is very useful to compare the skill of several models, or observations in a single plot.
cmp.plot.taylor();
---------------------------------------------------------------------------
ValueError                                Traceback (most recent call last)
Cell In[10], line 1
----> 1 cmp.plot.taylor();

File /opt/hostedtoolcache/Python/3.13.12/x64/lib/python3.13/site-packages/modelskill/comparison/_comparer_plotter.py:754, in ComparerPlotter.taylor(self, normalize_std, figsize, marker, marker_size, title)
    748 pts = [
    749     TaylorPoint(name=r.model, obs_std=r.obs_std, std=r.std, cc=r.cc, marker=marker, marker_size=marker_size)
    750     for r in df.itertuples()
    751 ]
    753 # TODO consistent return type with other plotting methods
--> 754 return taylor_diagram(
    755     obs_std=ref_std,
    756     points=pts,
    757     figsize=figsize,
    758     obs_text=f"Obs: {cmp.name}",
    759     normalize_std=normalize_std,
    760     title=title,
    761 )

File /opt/hostedtoolcache/Python/3.13.12/x64/lib/python3.13/site-packages/modelskill/plotting/_taylor_diagram.py:68, in taylor_diagram(obs_std, points, figsize, obs_text, normalize_std, ax, title)
     65 if len(obs_text) > 30:
     66     obs_text = obs_text[:25] + "..."
---> 68 td = TaylorDiagram(
     69     obs_std, fig=fig, rect=111, label=obs_text, normalize_std=normalize_std
     70 )
     71 contours = td.add_contours(levels=8, colors="0.5", linestyles="dotted")
     72 plt.clabel(contours, inline=1, fontsize=10, fmt="%.2f")

File /opt/hostedtoolcache/Python/3.13.12/x64/lib/python3.13/site-packages/modelskill/plotting/_taylor_diagram_external.py:87, in TaylorDiagram.__init__(self, refstd, fig, rect, label, srange, extend, normalize_std)
     84 if fig is None:
     85     fig = plt.figure()
---> 87 ax = FA.FloatingSubplot(fig, rect, grid_helper=ghelper)
     88 fig.add_subplot(ax)
     90 # Adjust axes

File /opt/hostedtoolcache/Python/3.13.12/x64/lib/python3.13/site-packages/mpl_toolkits/axisartist/floating_axes.py:240, in FloatingAxesBase.__init__(self, grid_helper, *args, **kwargs)
    238 def __init__(self, *args, grid_helper, **kwargs):
    239     _api.check_isinstance(GridHelperCurveLinear, grid_helper=grid_helper)
--> 240     super().__init__(*args, grid_helper=grid_helper, **kwargs)
    241     self.set_aspect(1.)

File /opt/hostedtoolcache/Python/3.13.12/x64/lib/python3.13/site-packages/mpl_toolkits/axes_grid1/parasite_axes.py:83, in HostAxesBase.__init__(self, *args, **kwargs)
     81 def __init__(self, *args, **kwargs):
     82     self.parasites = []
---> 83     super().__init__(*args, **kwargs)

File /opt/hostedtoolcache/Python/3.13.12/x64/lib/python3.13/site-packages/mpl_toolkits/axisartist/axislines.py:376, in Axes.__init__(self, grid_helper, *args, **kwargs)
    374 self._axisline_on = True
    375 self._grid_helper = grid_helper if grid_helper else GridHelperRectlinear(self)
--> 376 super().__init__(*args, **kwargs)
    377 self.toggle_axisline(True)

File /opt/hostedtoolcache/Python/3.13.12/x64/lib/python3.13/site-packages/matplotlib/axes/_base.py:732, in _AxesBase.__init__(self, fig, facecolor, frameon, sharex, sharey, label, xscale, yscale, box_aspect, forward_navigation_events, *args, **kwargs)
    729 self.set_axisbelow(mpl.rcParams['axes.axisbelow'])
    731 self._rasterization_zorder = None
--> 732 self.clear()
    734 # funcs used to format x and y - fall back on major formatters
    735 self.fmt_xdata = None

File /opt/hostedtoolcache/Python/3.13.12/x64/lib/python3.13/site-packages/mpl_toolkits/axisartist/floating_axes.py:262, in FloatingAxesBase.clear(self)
    260 self.patch.set_clip_path(orig_patch)
    261 self.gridlines.set_clip_path(orig_patch)
--> 262 self.adjust_axes_lim()

File /opt/hostedtoolcache/Python/3.13.12/x64/lib/python3.13/site-packages/mpl_toolkits/axisartist/floating_axes.py:265, in FloatingAxesBase.adjust_axes_lim(self)
    264 def adjust_axes_lim(self):
--> 265     bbox = self.patch.get_path().get_extents(
    266         # First transform to pixel coords, then to parent data coords.
    267         self.patch.get_transform() - self.transData)
    268     bbox = bbox.expanded(1.02, 1.02)
    269     self.set_xlim(bbox.xmin, bbox.xmax)

File /opt/hostedtoolcache/Python/3.13.12/x64/lib/python3.13/site-packages/matplotlib/path.py:645, in Path.get_extents(self, transform, **kwargs)
    643 from .transforms import Bbox
    644 if transform is not None:
--> 645     self = transform.transform_path(self)
    646 if self.codes is None:
    647     xys = self.vertices

File /opt/hostedtoolcache/Python/3.13.12/x64/lib/python3.13/site-packages/matplotlib/transforms.py:1601, in Transform.transform_path(self, path)
   1594 def transform_path(self, path):
   1595     """
   1596     Apply the transform to `.Path` *path*, returning a new `.Path`.
   1597
   1598     In some cases, this transform may insert curves into the path
   1599     that began as line segments.
   1600     """
-> 1601     return self.transform_path_affine(self.transform_path_non_affine(path))

File /opt/hostedtoolcache/Python/3.13.12/x64/lib/python3.13/site-packages/matplotlib/projections/polar.py:147, in PolarTransform.transform_path_non_affine(self, path)
    145         codes.extend([c] * len(trs))
    146     last_t, last_r = trs[-1]
--> 147 return Path(xys, codes)

File /opt/hostedtoolcache/Python/3.13.12/x64/lib/python3.13/site-packages/matplotlib/path.py:130, in Path.__init__(self, vertices, codes, _interpolation_steps, closed, readonly)
    101 """
    102 Create a new path with the given vertices and codes.
    103
   (...)    127     and codes as read-only arrays.
    128 """
    129 vertices = _to_unmasked_float_array(vertices)
--> 130 _api.check_shape((None, 2), vertices=vertices)
    132 if codes is not None and len(vertices):
    133     codes = np.asarray(codes, self.code_type)

File /opt/hostedtoolcache/Python/3.13.12/x64/lib/python3.13/site-packages/matplotlib/_api/__init__.py:176, in check_shape(shape, **kwargs)
    173 if len(shape) == 1:
    174     text_shape += ","
--> 176 raise ValueError(
    177     f"{k!r} must be {len(shape)}D with shape ({text_shape}), "
    178     f"but your input has shape {v.shape}"
    179 )

ValueError: 'vertices' must be 2D with shape (N, 2), but your input has shape (0,)
<Figure size 700x700 with 0 Axes>
Elaborate comparison#
fn = 'data/SW/HKZN_local_2017_DutchCoast.dfsu'
mr = ms.model_result(fn, name='HKZN_local', item=0)
mr
<DfsuModelResult>: HKZN_local
Time: 2017-10-27 00:00:00 - 2017-10-29 18:00:00
Quantity: Significant wave height [m]
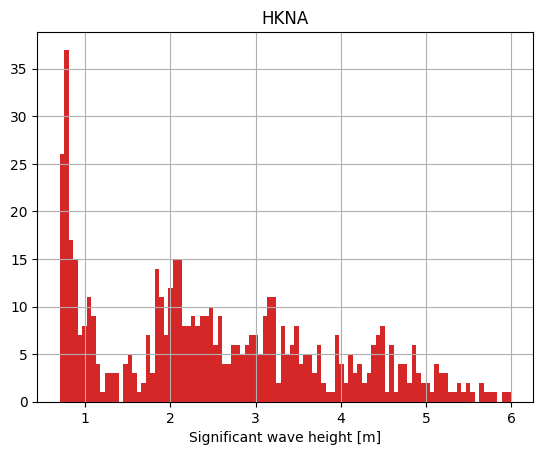
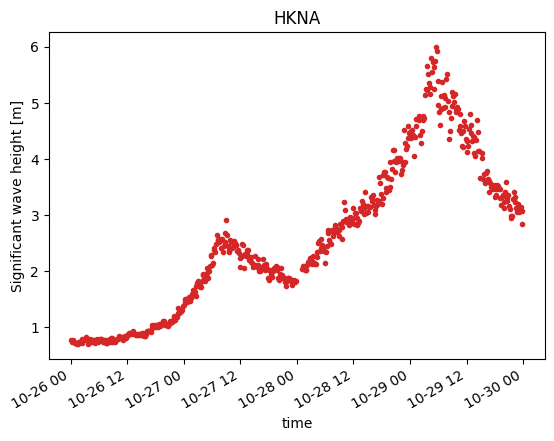
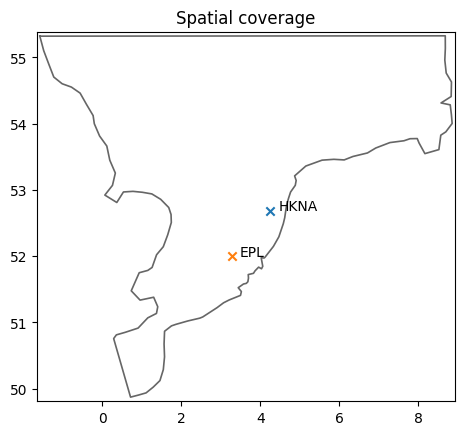
o1 = ms.PointObservation('data/SW/HKNA_Hm0.dfs0', item=0, x=4.2420, y=52.6887, name="HKNA")
o2 = ms.PointObservation("data/SW/eur_Hm0.dfs0", item=0, x=3.2760, y=51.9990, name="EPL")
o1.plot.hist();
o1.plot();
Overview#
ms.plotting.spatial_overview(obs=[o1,o2], mod=mr);
cc = ms.match(obs=[o1,o2], mod=mr)
cc
/opt/hostedtoolcache/Python/3.13.12/x64/lib/python3.13/site-packages/mikeio/dataset/_dataset.py:505: FutureWarning: 'inplace' parameter is deprecated and will be removed in future versions. Use ds = ds.rename(...) instead.
  warnings.warn(
/opt/hostedtoolcache/Python/3.13.12/x64/lib/python3.13/site-packages/mikeio/dataset/_dataset.py:505: FutureWarning: 'inplace' parameter is deprecated and will be removed in future versions. Use ds = ds.rename(...) instead.
  warnings.warn(
<ComparerCollection>
Comparers:
0: HKNA - Significant wave height [m]
1: EPL - Significant wave height [m]
cc.skill().style(precision=2)
/opt/hostedtoolcache/Python/3.13.12/x64/lib/python3.13/site-packages/modelskill/metrics.py:344: RuntimeWarning: divide by zero encountered in scalar divide
  return 1 - SSr / SSt
/opt/hostedtoolcache/Python/3.13.12/x64/lib/python3.13/site-packages/modelskill/skill.py:804: FutureWarning: precision is deprecated, it has been renamed to decimals
  warnings.warn(
/opt/hostedtoolcache/Python/3.13.12/x64/lib/python3.13/site-packages/pandas/io/formats/style.py:4202: RuntimeWarning: All-NaN slice encountered
  smin = np.nanmin(gmap) if vmin is None else vmin
/opt/hostedtoolcache/Python/3.13.12/x64/lib/python3.13/site-packages/pandas/io/formats/style.py:4203: RuntimeWarning: All-NaN slice encountered
  smax = np.nanmax(gmap) if vmax is None else vmax
/opt/hostedtoolcache/Python/3.13.12/x64/lib/python3.13/site-packages/pandas/io/formats/style.py:4204: RuntimeWarning: invalid value encountered in scalar subtract
  rng = smax - smin
| n | bias | rmse | urmse | mae | cc | si | r2 | |
|---|---|---|---|---|---|---|---|---|
| observation | ||||||||
| HKNA | 1 | 0.19 | 0.19 | 0.00 | 0.19 | nan | 0.00 | -inf |
| EPL | 1 | 0.52 | 0.52 | 0.00 | 0.52 | nan | 0.00 | -inf |
cc["EPL"].skill(metrics="mean_absolute_error")
| n | mean_absolute_error | |
|---|---|---|
| observation | ||
| EPL | 1 | 0.518057 |
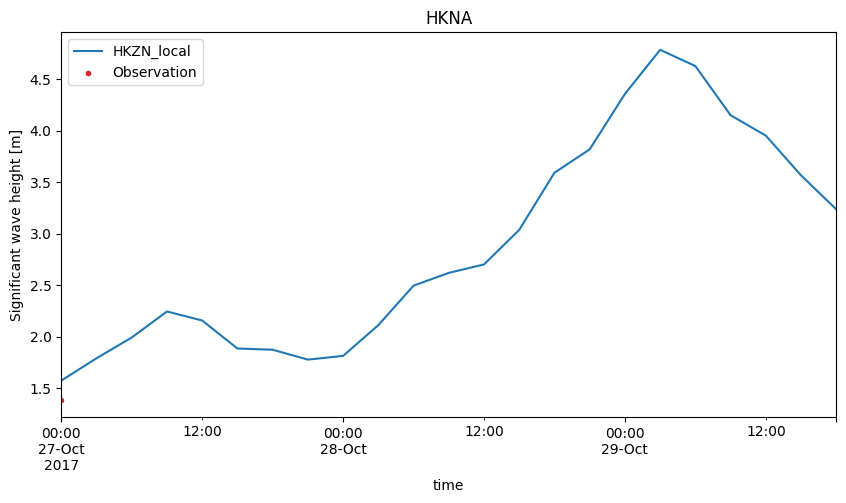
cc["HKNA"].plot.timeseries(figsize=(10,5));
cc["EPL"].plot.scatter(figsize=(8,8), show_hist=True);
---------------------------------------------------------------------------
ValueError                                Traceback (most recent call last)
Cell In[20], line 1
----> 1 cc["EPL"].plot.scatter(figsize=(8,8), show_hist=True);

File /opt/hostedtoolcache/Python/3.13.12/x64/lib/python3.13/site-packages/modelskill/comparison/_comparer_plotter.py:565, in ComparerPlotter.scatter(self, model, bins, quantiles, fit_to_quantiles, show_points, show_hist, show_density, norm, backend, figsize, xlim, ylim, reg_method, title, xlabel, ylabel, skill_table, ax, **kwargs)
    563 axes = []
    564 for mod_name in mod_names:
--> 565     ax_mod = self._scatter_one_model(
    566         mod_name=mod_name,
    567         bins=bins,
    568         quantiles=quantiles,
    569         fit_to_quantiles=fit_to_quantiles,
    570         show_points=show_points,
    571         show_hist=show_hist,
    572         show_density=show_density,
    573         norm=norm,
    574         backend=backend,
    575         figsize=figsize,
    576         xlim=xlim,
    577         ylim=ylim,
    578         reg_method=reg_method,
    579         title=title,
    580         xlabel=xlabel,
    581         ylabel=ylabel,
    582         skill_table=skill_table,
    583         ax=ax,
    584         **kwargs,
    585     )
    586     axes.append(ax_mod)
    587 return axes[0] if len(axes) == 1 else axes

File /opt/hostedtoolcache/Python/3.13.12/x64/lib/python3.13/site-packages/modelskill/comparison/_comparer_plotter.py:649, in ComparerPlotter._scatter_one_model(self, mod_name, bins, quantiles, fit_to_quantiles, show_points, show_hist, show_density, norm, backend, figsize, xlim, ylim, reg_method, title, xlabel, ylabel, skill_table, **kwargs)
    645     reg_method = False
    647 skill_scores = skill.iloc[0].to_dict() if skill is not None else None
--> 649 ax = scatter(
    650     x=x,
    651     y=y,
    652     bins=bins,
    653     quantiles=quantiles,
    654     fit_to_quantiles=fit_to_quantiles,
    655     show_points=show_points,
    656     show_hist=show_hist,
    657     show_density=show_density,
    658     norm=norm,
    659     backend=backend,
    660     figsize=figsize,
    661     xlim=xlim,
    662     ylim=ylim,
    663     reg_method=reg_method,
    664     title=title,
    665     xlabel=xlabel,
    666     ylabel=ylabel,
    667     skill_scores=skill_scores,
    668     skill_score_unit=skill_score_unit,
    669     **kwargs,
    670 )
    672 if backend == "matplotlib" and self.is_directional:
    673     _xtick_directional(ax, xlim)

File /opt/hostedtoolcache/Python/3.13.12/x64/lib/python3.13/site-packages/modelskill/plotting/_scatter.py:228, in scatter(x, y, bins, quantiles, fit_to_quantiles, show_points, show_hist, show_density, norm, backend, figsize, xlim, ylim, reg_method, title, xlabel, ylabel, skill_table, skill_scores, skill_score_unit, ax, **kwargs)
    225     skill = cmp.skill(metrics=metrics)
    226     skill_scores = skill.to_dict("records")[0]
--> 228 return PLOTTING_BACKENDS[backend](
    229     x=x,
    230     y=y,
    231     x_sample=x_sample,
    232     y_sample=y_sample,
    233     z=z,
    234     xq=xq,
    235     yq=yq,
    236     x_trend=x_trend,
    237     show_density=show_density,
    238     norm=norm,
    239     show_points=show_points,
    240     show_hist=show_hist,
    241     nbins_hist=nbins_hist,
    242     reg_method=reg_method,
    243     xlabel=xlabel,
    244     ylabel=ylabel,
    245     figsize=figsize,
    246     xlim=xlim,
    247     ylim=ylim,
    248     title=title,
    249     skill_scores=skill_scores,
    250     skill_score_unit=skill_score_unit,
    251     fit_to_quantiles=fit_to_quantiles,
    252     ax=ax,
    253     **kwargs,
    254 )

File /opt/hostedtoolcache/Python/3.13.12/x64/lib/python3.13/site-packages/modelskill/plotting/_scatter.py:289, in _scatter_matplotlib(x, y, x_sample, y_sample, z, xq, yq, x_trend, show_density, show_points, show_hist, norm, nbins_hist, reg_method, xlabel, ylabel, figsize, xlim, ylim, title, skill_scores, skill_score_unit, fit_to_quantiles, ax, cmap, **kwargs)
    286 fig, ax = _get_fig_ax(ax, figsize)
    288 if len(x) < 2:
--> 289     raise ValueError("Not enough data to plot. At least 2 points are required.")
    291 ax.plot(
    292     [xlim[0], xlim[1]],
    293     [xlim[0], xlim[1]],
   (...)    296     zorder=3,
    297 )
    299 if show_points is None or show_points:

ValueError: Not enough data to plot. At least 2 points are required.
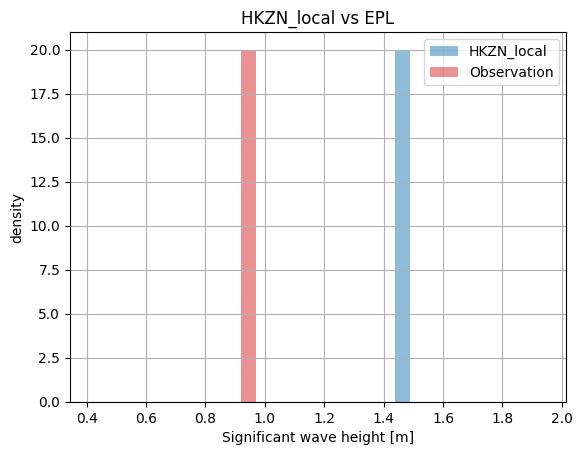
cc["EPL"].plot.hist(bins=20);
cc["HKNA"].plot.scatter();
---------------------------------------------------------------------------
ValueError                                Traceback (most recent call last)
Cell In[22], line 1
----> 1 cc["HKNA"].plot.scatter();

File /opt/hostedtoolcache/Python/3.13.12/x64/lib/python3.13/site-packages/modelskill/comparison/_comparer_plotter.py:565, in ComparerPlotter.scatter(self, model, bins, quantiles, fit_to_quantiles, show_points, show_hist, show_density, norm, backend, figsize, xlim, ylim, reg_method, title, xlabel, ylabel, skill_table, ax, **kwargs)
    563 axes = []
    564 for mod_name in mod_names:
--> 565     ax_mod = self._scatter_one_model(
    566         mod_name=mod_name,
    567         bins=bins,
    568         quantiles=quantiles,
    569         fit_to_quantiles=fit_to_quantiles,
    570         show_points=show_points,
    571         show_hist=show_hist,
    572         show_density=show_density,
    573         norm=norm,
    574         backend=backend,
    575         figsize=figsize,
    576         xlim=xlim,
    577         ylim=ylim,
    578         reg_method=reg_method,
    579         title=title,
    580         xlabel=xlabel,
    581         ylabel=ylabel,
    582         skill_table=skill_table,
    583         ax=ax,
    584         **kwargs,
    585     )
    586     axes.append(ax_mod)
    587 return axes[0] if len(axes) == 1 else axes

File /opt/hostedtoolcache/Python/3.13.12/x64/lib/python3.13/site-packages/modelskill/comparison/_comparer_plotter.py:649, in ComparerPlotter._scatter_one_model(self, mod_name, bins, quantiles, fit_to_quantiles, show_points, show_hist, show_density, norm, backend, figsize, xlim, ylim, reg_method, title, xlabel, ylabel, skill_table, **kwargs)
    645     reg_method = False
    647 skill_scores = skill.iloc[0].to_dict() if skill is not None else None
--> 649 ax = scatter(
    650     x=x,
    651     y=y,
    652     bins=bins,
    653     quantiles=quantiles,
    654     fit_to_quantiles=fit_to_quantiles,
    655     show_points=show_points,
    656     show_hist=show_hist,
    657     show_density=show_density,
    658     norm=norm,
    659     backend=backend,
    660     figsize=figsize,
    661     xlim=xlim,
    662     ylim=ylim,
    663     reg_method=reg_method,
    664     title=title,
    665     xlabel=xlabel,
    666     ylabel=ylabel,
    667     skill_scores=skill_scores,
    668     skill_score_unit=skill_score_unit,
    669     **kwargs,
    670 )
    672 if backend == "matplotlib" and self.is_directional:
    673     _xtick_directional(ax, xlim)

File /opt/hostedtoolcache/Python/3.13.12/x64/lib/python3.13/site-packages/modelskill/plotting/_scatter.py:228, in scatter(x, y, bins, quantiles, fit_to_quantiles, show_points, show_hist, show_density, norm, backend, figsize, xlim, ylim, reg_method, title, xlabel, ylabel, skill_table, skill_scores, skill_score_unit, ax, **kwargs)
    225     skill = cmp.skill(metrics=metrics)
    226     skill_scores = skill.to_dict("records")[0]
--> 228 return PLOTTING_BACKENDS[backend](
    229     x=x,
    230     y=y,
    231     x_sample=x_sample,
    232     y_sample=y_sample,
    233     z=z,
    234     xq=xq,
    235     yq=yq,
    236     x_trend=x_trend,
    237     show_density=show_density,
    238     norm=norm,
    239     show_points=show_points,
    240     show_hist=show_hist,
    241     nbins_hist=nbins_hist,
    242     reg_method=reg_method,
    243     xlabel=xlabel,
    244     ylabel=ylabel,
    245     figsize=figsize,
    246     xlim=xlim,
    247     ylim=ylim,
    248     title=title,
    249     skill_scores=skill_scores,
    250     skill_score_unit=skill_score_unit,
    251     fit_to_quantiles=fit_to_quantiles,
    252     ax=ax,
    253     **kwargs,
    254 )

File /opt/hostedtoolcache/Python/3.13.12/x64/lib/python3.13/site-packages/modelskill/plotting/_scatter.py:289, in _scatter_matplotlib(x, y, x_sample, y_sample, z, xq, yq, x_trend, show_density, show_points, show_hist, norm, nbins_hist, reg_method, xlabel, ylabel, figsize, xlim, ylim, title, skill_scores, skill_score_unit, fit_to_quantiles, ax, cmap, **kwargs)
    286 fig, ax = _get_fig_ax(ax, figsize)
    288 if len(x) < 2:
--> 289     raise ValueError("Not enough data to plot. At least 2 points are required.")
    291 ax.plot(
    292     [xlim[0], xlim[1]],
    293     [xlim[0], xlim[1]],
   (...)    296     zorder=3,
    297 )
    299 if show_points is None or show_points:

ValueError: Not enough data to plot. At least 2 points are required.