Z80
Z80 is the designation for one of the case districts in Aarhus. The district / pressure zone has one supplying water works, elevated storage and several control exchange points with other pressure zones, as well as 4 sections with residents and industry.
Z80 is the primary site or area for the research into model predictive control.
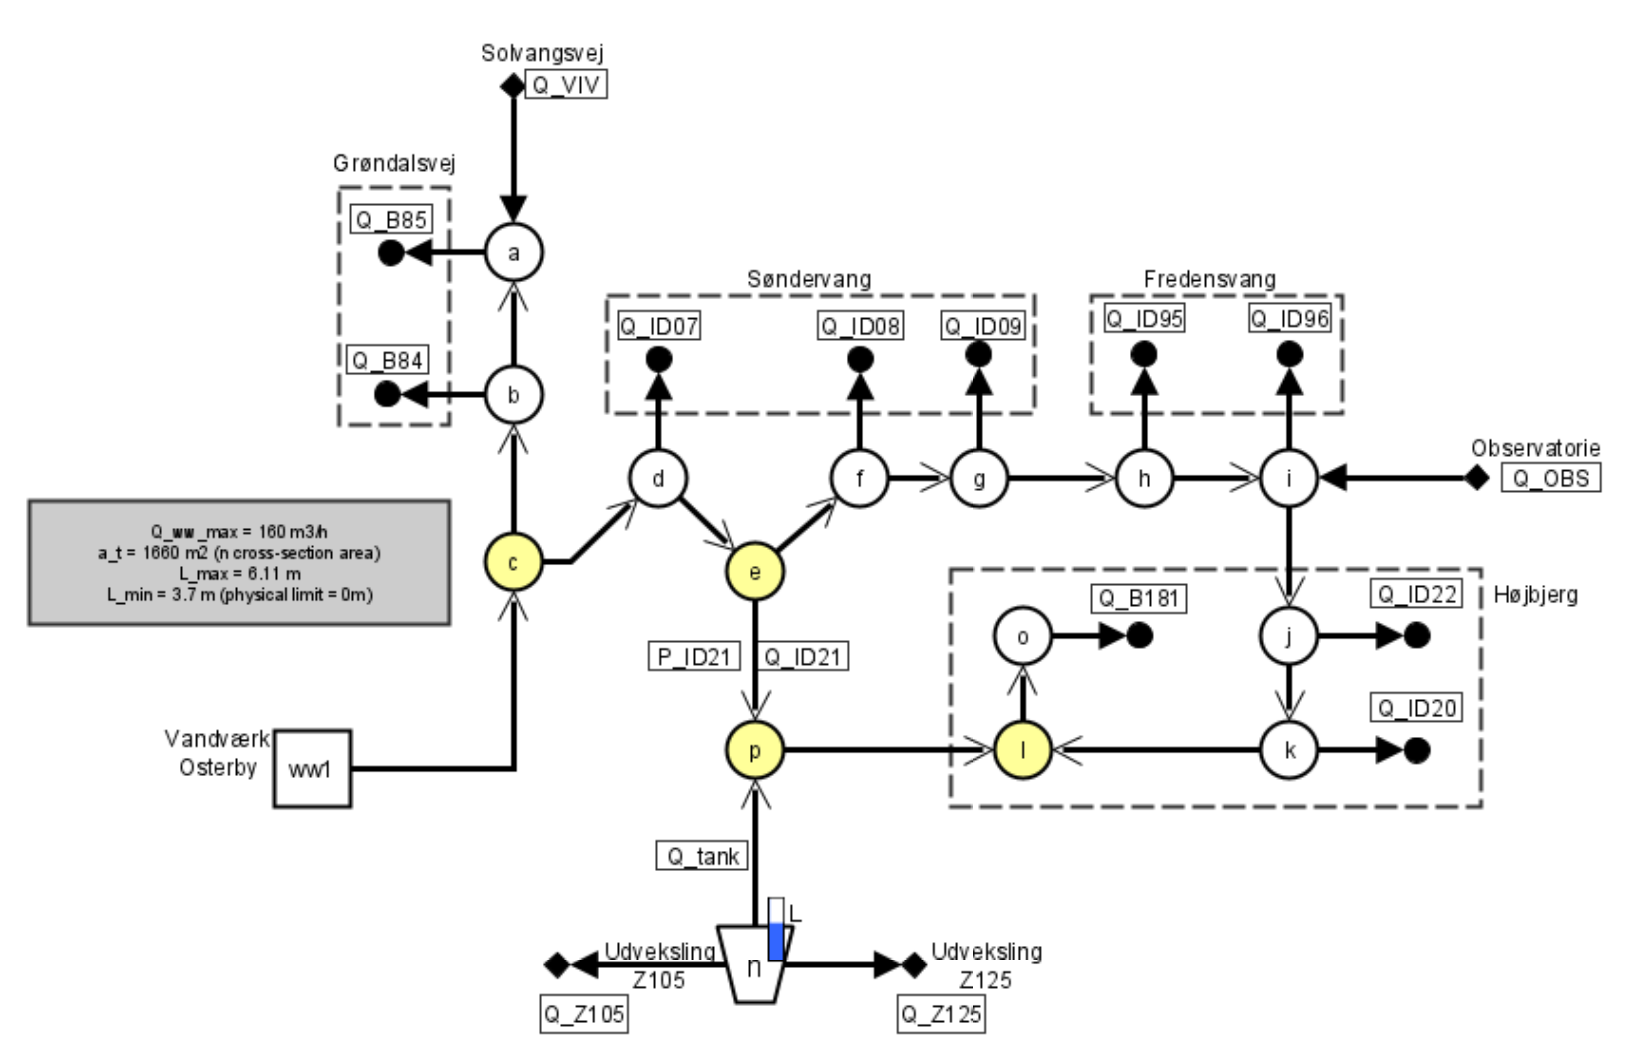
Initial Model design for z80
All distribution wells / measurering stations were included in the first model as states.
Yellow labelled nodes are not associated with any distribution well, but exists as necessary junctions.
These states can still be estimated by some data handling algorithms.
All the full (black) symbols are boundary conditions, mostly demands organised in sections (basically neighbourhoods), and
some controlled exchange points to other pressure zones.

This is the signature for the symbols in the graph

Micro model
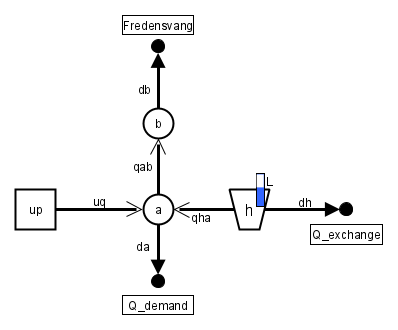
Following the process outlined in the design philosophy, we designated the final design as the micro model. This is the model, which is used in the model predictive controller. It is identified as a minimal design, that can address the control objectives also in the design philosophy.
- up & uq, are the water works and the discharge flow. u is the symbol for control input. The water works is represented with a pump model
- h is the elevated storage.
- b is a measuring station gating the Fredensvang section. Inside Fredensvang the critical pressure point is located, ie. the household / resident where the largest pressure loss is induced.
- a is a representation of the transmission lines, connecting the entire pressure zone. We assume the pressure loss is negligible in the transmission pipe. Additionally, it is a circular connection, which also contributes to a homogenous system.

There are certain assumptions in this design, which experiments have proven are accurate. However several other designs have been investigated and deserve mentioning.
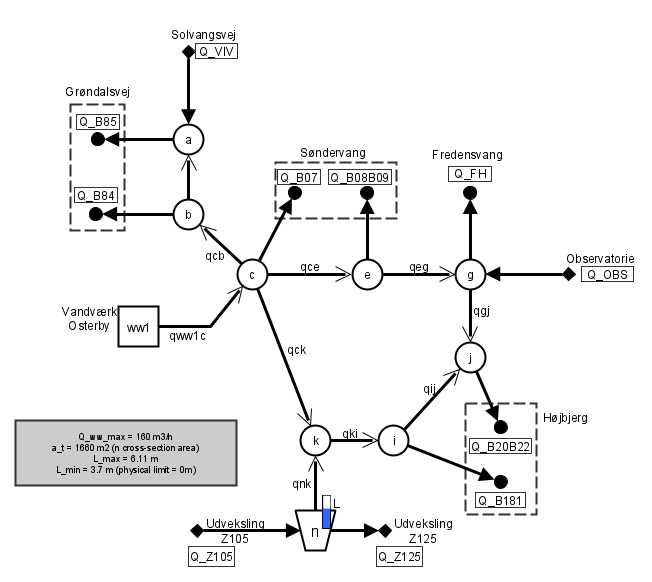
Compact model
The compact model included more states, trying to identify if the dynamics across the circular transmission pipe would have a significant impact. Also, this design investigates how minor reductions create a more pronounced model gradient; this can't be observed in the micro design, where the system is reduced to a degree, that the dynamics between specific sensors are completely obscure.

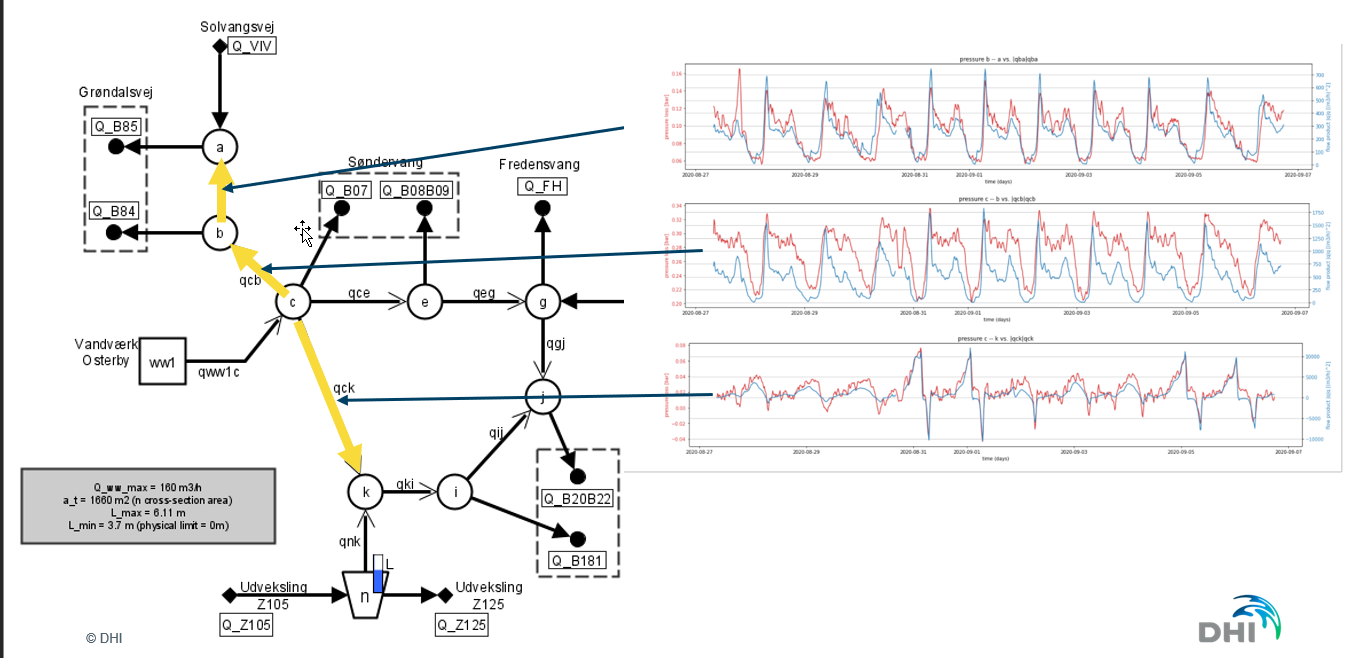
In the image below, some key results are given to justify the pressure loss relation. Each plot is associated with a link, showing pressure loss in red and the flow product in blue. Since the two quantities are plotted on separate axes, it is more or less given that they seem propertional, if the lines have similar shape. This proportionality is exactly what the pipe resistance, \alpha predicts.

Nano model
Taking a different approach to the control, we also investigated how a control system that did not include the pressure dynamics would perform. This model has a very simple design. It's concept is quite close to that of a traditional PID control strategy, as it is only concerned with solving the massbalance and paying attention to storage tank water level. A key difference, however, is that this design utilises a demand forecast, and can preemptively respons to a high demand, if it is forecasted.
