Pump system characteristics
Z80 Osterby
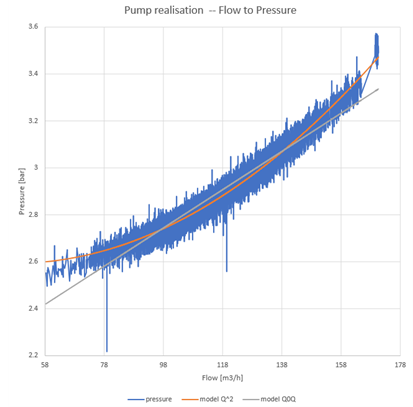
In figure the relationship between Flow and Pressure is displayed. Flow and pressure are both measured quantities, ie. this is the effect that the pump exerts on the system. A conclusion could be that when the flow is at a specific rate, the exerted pressure happens to be required at a corresponding level. The relation is quadratic (orange line is the best fit). Using the flow average as a linearisation point, a linear relation has been attempted as well, where gray is the best fit. The same linearisation strategy as flow-pressureloss for reaches can be utilized here, where the current flow is taken as linearisation. The variance is not insignificant. Here are three suggestions:
- It can be that this is natural, when collecting 40 000 pairs of data. At this scale the data certainly seems evenly distributed.
- It could be that, this way of thinking about discharge and pressure is in fact observing the net pressure suction head (npsh), meaning that this pressure is dependant on the waterworks storage tank level.
- The relation may depend on the general counter resistance in the system, suggesting that the waterdemand or elevated storage level would somehow be a relevant third axis to consider.

Z105 Beder and Osterby
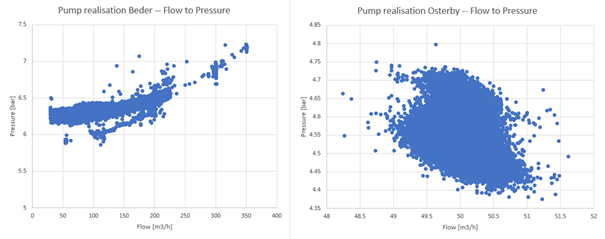
A similar analysis for Z105 has been conducted, though not attempting to fit a function. The flow controlled Beder waterworks show a similar trend.
The pump control at Osterby has a fixed flow target. It seems that the relation does not hold to the same extend here. Closer inspection shows that with the fixed flow, the observed range is much smaller: The same relation might hold, would the pump be allowed a larger operation range.
Maybe even more relevant here, another dimension (water demand) might reveal that the pump at Osterby is not a purely stochastic proces, but that it does in fact have some structure.
