import mikeio
import modelskill as ms
ds = mikeio.read("../data/wave_dir.dfs0")
df = ds[[0, 2, 1, 3]].to_dataframe()
ms.plotting.wind_rose(df)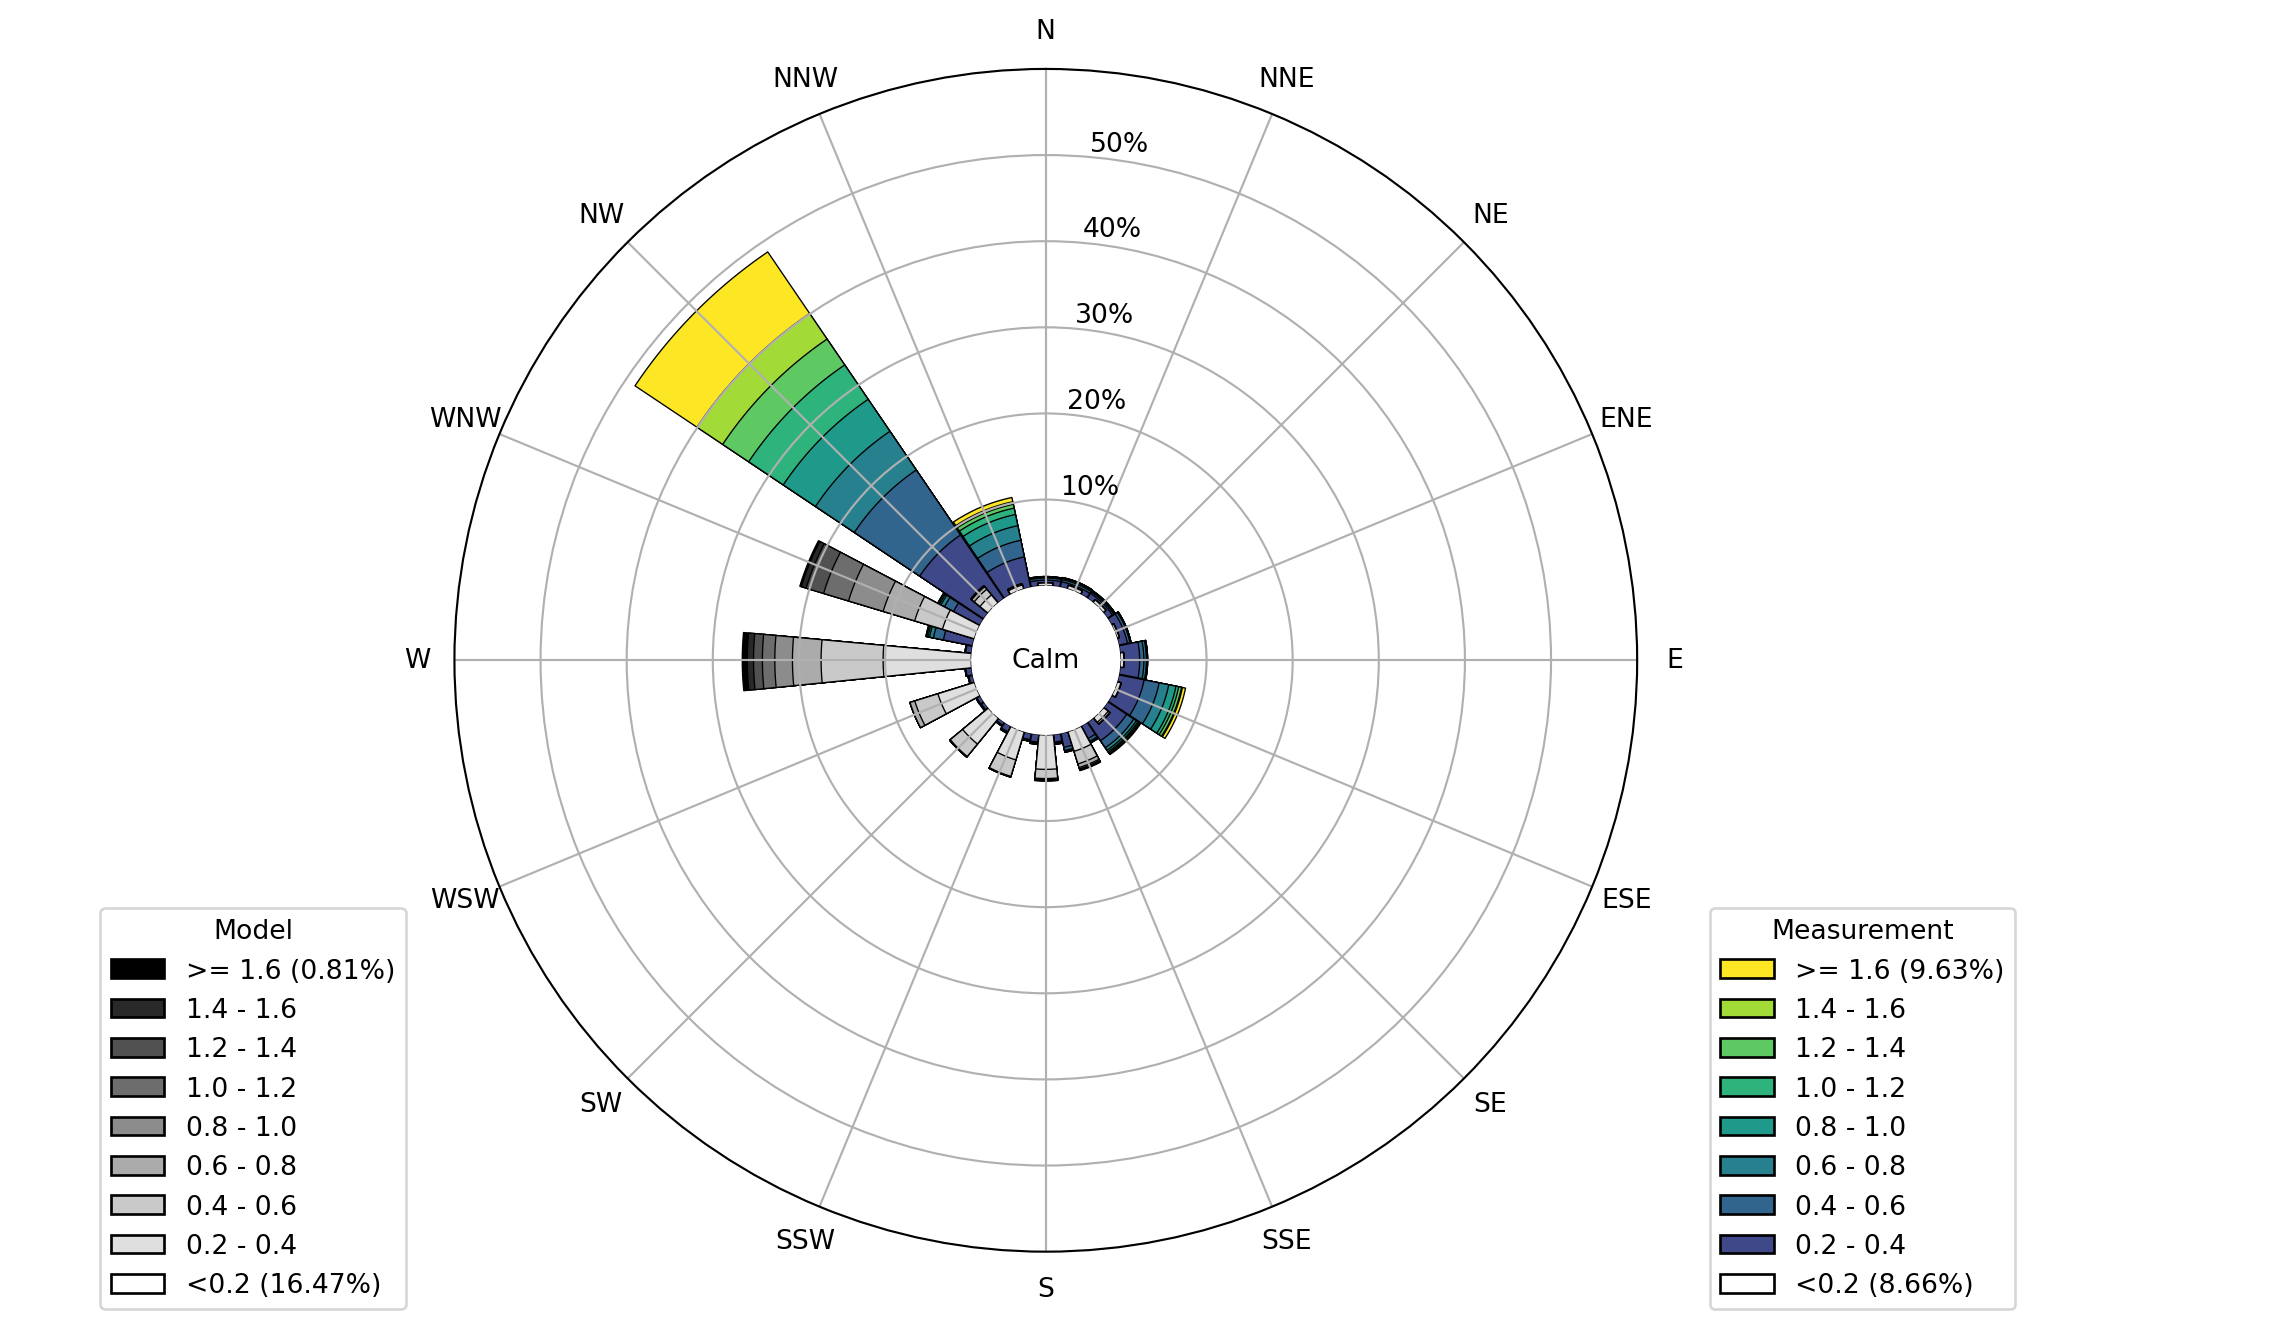
plotting.wind_rose(
    data,
    *,
    labels=('Measurement', 'Model'),
    mag_step=None,
    n_sectors=16,
    calm_threshold=None,
    calm_size=None,
    calm_text='Calm',
    r_step=0.1,
    r_max=None,
    legend=True,
    cmap1='viridis',
    cmap2='Greys',
    mag_bins=None,
    max_bin=None,
    n_dir_labels=None,
    secondary_dir_step_factor=2.0,
    figsize=(8, 8),
    ax=None,
    title=None,
)
Plots a (dual) wind (wave or current) roses with calms.
The size of the calm is determined by the primary (measurement) data.
| Name | Type | Description | Default |
|---|---|---|---|
| data | array with 2 or 4 columns (magnitude, direction, magnitude2, direction2) | required | |
| labels | tuple[str, str] | labels for the legend(s) | ('Measurement', 'Model') |
| mag_step | float | None | discretization for magnitude (delta_r, in radial direction ) | None |
| n_sectors | int | number of directional sectors | 16 |
| calm_threshold | float | None | minimum value for data being counted as valid (i.e. below this is calm) | None |
| calm_text | str | text to display in calm. | 'Calm' |
| r_step | float | radial axis discretization. By default 0.1 i.e. every 10%. | 0.1 |
| r_max | float | None | maximum radius (%) of plot, e.g. if 50% wanted then r_max=0.5 | None |
| max_bin | float | None | max value to truncate the data, e.g., max_bin=1.0 if hm0=1m is the desired final bin. | None |
| mag_bins | array of floats (optional) Default = None | force bins to array of values, e.g. when specifying non-equidistant bins. | None |
| legend | bool | show legend | True |
| cmap1 | string. Default= 'viridis' | colormap for main axis | 'viridis' |
| cmap2 | string. Default= 'Greys' | colormap for secondary axis | 'Greys' |
| n_dir_labels | int. Default= 4 | number of labels in the polar plot, choose between 4, 8 or 16, default is to use the same as n_sectors | None |
| secondary_dir_step_factor | float. Default= 2.0 | reduce width of secondary axis by this factor | 2.0 |
| figsize | tuple[float, float] | figure size | (8, 8) |
| ax | Matplotlib axis to plot on defined as polar, it can be done using “subplot_kw = dict(projection = ‘polar’)”. Default = None, new axis created. | None |
|
| title | title of the plot | None |
| Name | Type | Description |
|---|---|---|
| matplotlib.axes.Axes | Matplotlib axis with the plot |
import mikeio
import modelskill as ms
ds = mikeio.read("../data/wave_dir.dfs0")
df = ds[[0, 2, 1, 3]].to_dataframe()
ms.plotting.wind_rose(df)