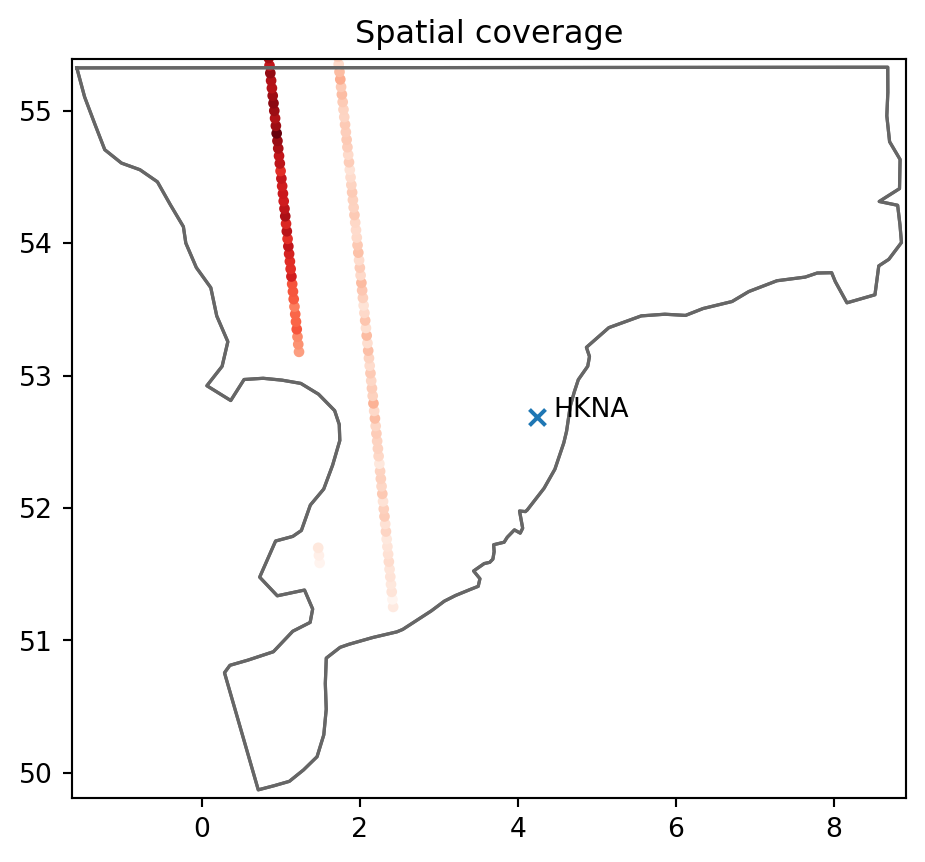
plotting.spatial_overview(obs, mod=None, ax=None, figsize=None, title=None)
Plot observation points on a map showing the model domain
Parameters
| obs |
Observation | Iterable[Observation] |
List of observations to be shown on map |
required |
| mod |
DfsuModelResult |
Model domain to be shown as outline |
None |
| ax |
|
Adding to existing axis, instead of creating new fig |
None |
| figsize |
(float, float) |
figure size, by default None |
None |
| title |
str | None |
plot title, default empty |
None |
See Also
temporal_coverage
Returns
|
matplotlib.axes.Axes |
The matplotlib axes object |
Examples
import modelskill as ms
from pathlib import Path
p = Path("../data/SW")

o1 = ms.PointObservation(p / "HKNA_Hm0.dfs0", item=0, x=4.2420, y=52.6887, name="HKNA")
o2 = ms.TrackObservation(p / "Alti_c2_Dutch.dfs0", item=3, name="c2")
mr = ms.DfsuModelResult(p / "HKZN_local_2017_DutchCoast.dfsu", name='SW_1', item=0)
ms.plotting.spatial_overview([o1, o2], mr)