plotting.temporal_coverage(
    obs=None,
    mod=None,
    *,
    limit_to_model_period=True,
    marker='_',
    ax=None,
    figsize=None,
    title=None,
)
Plot graph showing temporal coverage for all observations and models
Parameters
| obs |
List[Observation] |
Show observation(s) as separate lines on plot |
None |
| mod |
List[ModelResult] |
Show model(s) as separate lines on plot, by default None |
None |
| limit_to_model_period |
bool |
Show temporal coverage only for period covered by the model, by default True |
True |
| marker |
str |
plot marker for observations, by default “_” |
'_' |
| ax |
|
Adding to existing axis, instead of creating new fig |
None |
| figsize |
Tuple(float, float) |
size of figure, by default (7, 0.45*n_lines) |
None |
| title |
|
plot title, default empty |
None |
See Also
spatial_overview
Returns
|
matplotlib.axes.Axes |
The matplotlib axes object |
Examples
import modelskill as ms
from pathlib import Path
p = Path("../data/SW")
o1 = ms.PointObservation(p/'HKNA_Hm0.dfs0', item=0, x=4.2420, y=52.6887, name="HKNA")
o2 = ms.TrackObservation(p/"Alti_c2_Dutch.dfs0", item=3, name="c2")
mr1 = ms.DfsuModelResult(p/'HKZN_local_2017_DutchCoast.dfsu', name='SW_1', item=0)
mr2 = ms.DfsuModelResult(p/'HKZN_local_2017_DutchCoast_v2.dfsu', name='SW_2', item=0)
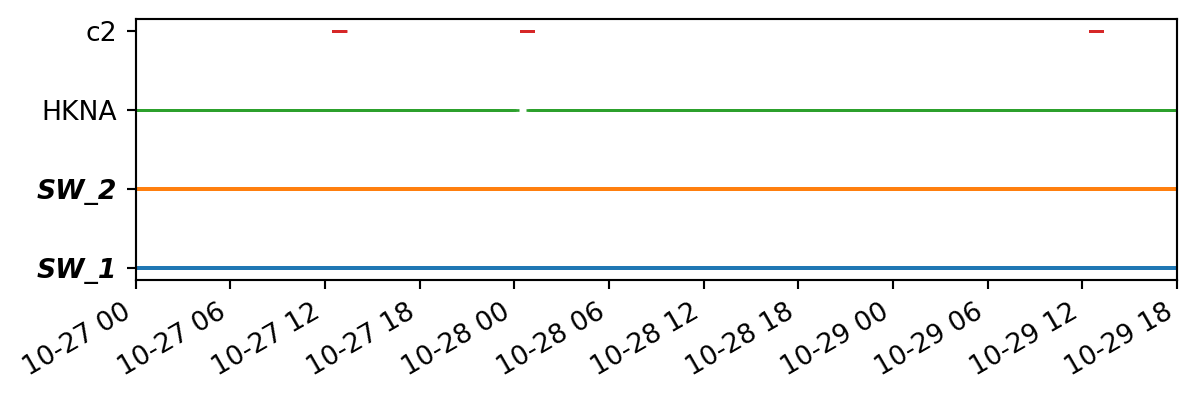
ms.plotting.temporal_coverage([o1, o2], [mr1, mr2])
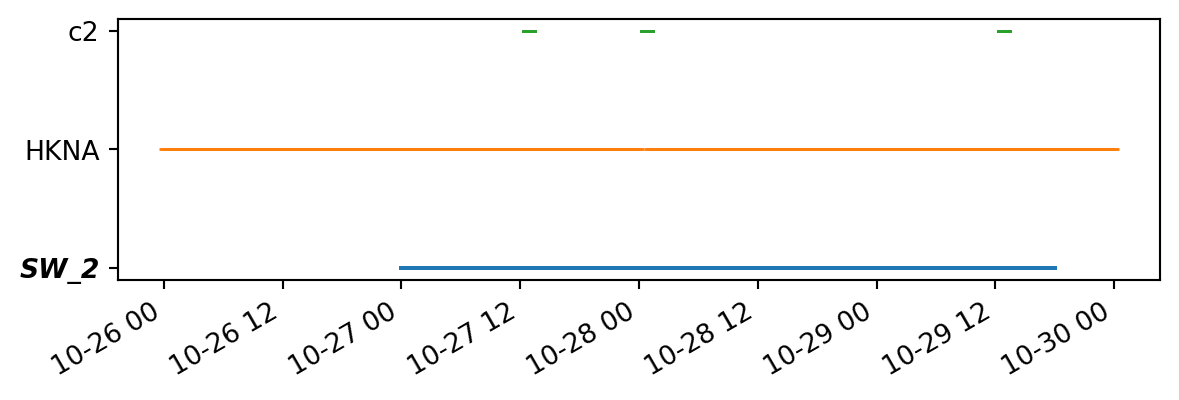
ms.plotting.temporal_coverage([o1, o2], mr2, limit_to_model_period=False)
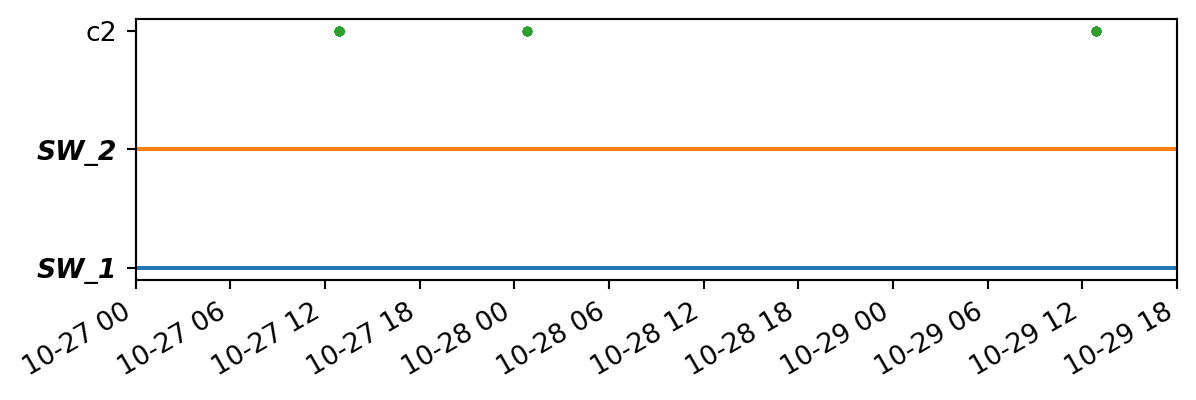
ms.plotting.temporal_coverage(o2, [mr1, mr2], marker=".")
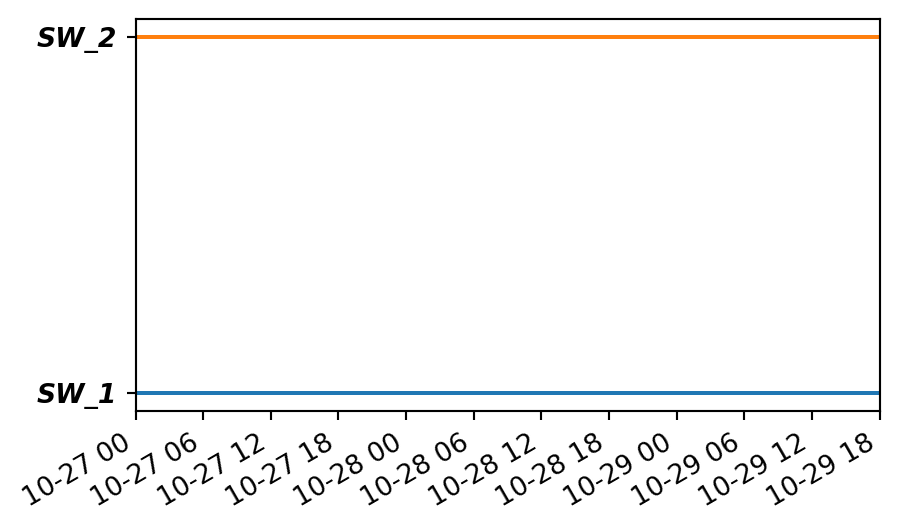
ms.plotting.temporal_coverage(mod=[mr1, mr2], figsize=(5,3))