import numpy as np
import modelskill as msCustom Metrics
ModelSkill comes with many metrics to choose from, but you can also define your own.
mr = ms.DfsuModelResult("../data/SW/HKZN_local_2017_DutchCoast.dfsu", name='HKZN_local', item=0)
o1 = ms.PointObservation("../data/SW/HKNA_Hm0.dfs0", item=0, x=4.2420, y=52.6887, name="HKNA")
o2 = ms.PointObservation("../data/SW/eur_Hm0.dfs0", item=0, x=3.2760, y=51.9990, name="EPL")
o3 = ms.TrackObservation("../data/SW/Alti_c2_Dutch.dfs0", item=3, name="c2")
cc = ms.match([o1, o2, o3], mr)
cc
<ComparerCollection>
Comparers:
0: HKNA - Significant wave height [m]
1: EPL - Significant wave height [m]
2: c2 - Significant wave height [m]Standard set of metrics
cc.skill()| n | bias | rmse | urmse | mae | cc | si | r2 | |
|---|---|---|---|---|---|---|---|---|
| observation | ||||||||
| HKNA | 386 | -0.202412 | 0.355195 | 0.291877 | 0.255866 | 0.971708 | 0.093967 | 0.903554 |
| EPL | 67 | -0.071238 | 0.224923 | 0.213344 | 0.189455 | 0.969760 | 0.082482 | 0.931793 |
| c2 | 113 | -0.004701 | 0.352470 | 0.352439 | 0.294758 | 0.975050 | 0.128010 | 0.899121 |
Some metrics has parameters, which require a bit special treatment.
from modelskill.metrics import hit_ratio, metric

@metric(best="+")
def hit_ratio_05_pct(obs, model):
    return hit_ratio(obs, model, 0.5) * 100

@metric(best="+")
def hit_ratio_01_pct(obs, model):
    return hit_ratio(obs, model, 0.1) * 100


cc.skill(metrics=[hit_ratio_05_pct, hit_ratio_01_pct])| n | hit_ratio_05_pct | hit_ratio_01_pct | |
|---|---|---|---|
| observation | |||
| HKNA | 386 | 86.528497 | 27.720207 |
| EPL | 67 | 98.507463 | 26.865672 |
| c2 | 113 | 85.840708 | 17.699115 |
And you are always free to specify your own special metric or import metrics from other libraries, e.g. scikit-learn.
@metric(best="-", has_units=True)
def mcae(obs, model):

    res = obs - model

    res_clipped = np.clip(res,0,np.inf)

    return np.mean(np.abs(res_clipped))


cc.skill(metrics=mcae).style()| n | mcae | |
|---|---|---|
| observation | ||
| HKNA | 386 | 0.229 |
| EPL | 67 | 0.130 |
| c2 | 113 | 0.150 |
Custom display name
Sometimes you like to modify the display name of the metrics. This can be done by passing a dictionary with the metric name as key and the display name as value to the display_name parameter.
@ms.metrics.metric(display_name="MEAN$_{Model}$", has_units="m")
def mean_mod(obs, mod):
    return mod.mean()

@ms.metrics.metric(display_name="MEAN$_{Obs}$", has_units="m")
def mean_obs(obs, mod):
    return obs.mean()

ms.metrics.add_metric(mean_mod)
ms.metrics.add_metric(mean_obs)

ms.metrics.pr.display_name = '$P_{ratio}$'
cc[0].plot.scatter(skill_table=["pr", mean_mod, mean_obs]);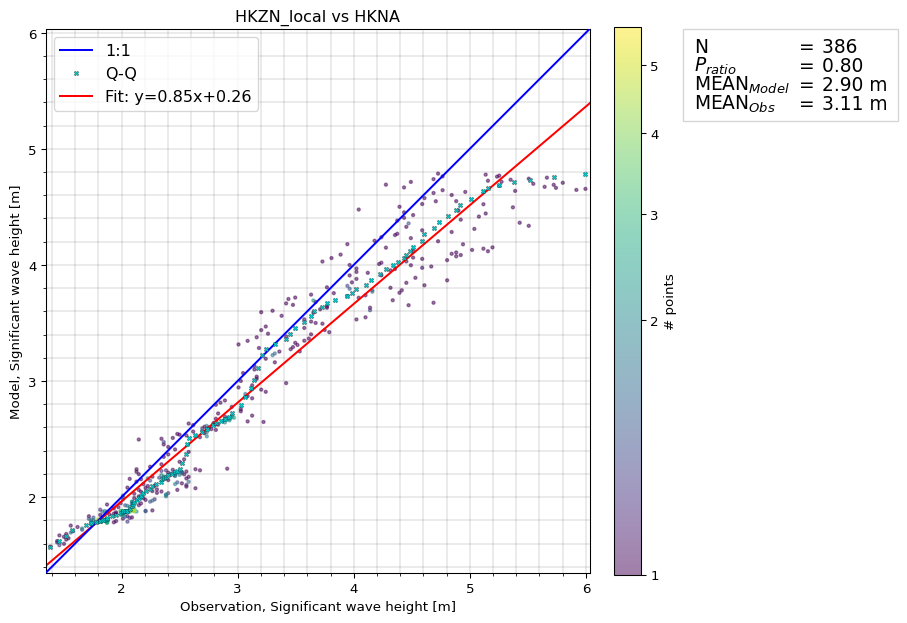
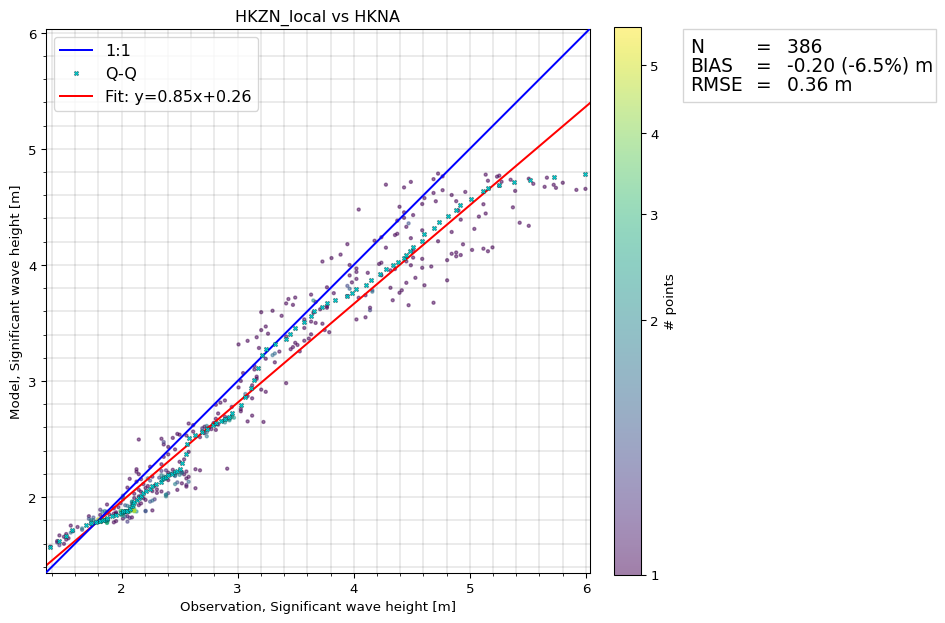
Custom format
In this example we modify bias to also add the perentage of the bias relative to the mean of the reference series.
from modelskill.metrics import bias as mybias

def bias(obs, mod):
    avg = obs.mean()
    bias = mybias(obs, mod)
    sign = "+" if bias > 0 else ""
    return f"{bias:.2f} ({sign}{bias/avg*100:.1f}%)"

cc[0].plot.scatter(skill_table=[bias, "rmse"]);