import pandas as pd
import matplotlib.pyplot as plt
import modelskill as msMetocean track comparison
Comparing MIKE 21 HD dfsu model result with satellite track observation of surface elevation.
This notebook also includes gridded spatial skill assessments.
Extract track data
mr = ms.model_result('../data/NorthSeaHD_and_windspeed.dfsu',
                     name='HD', item=0)
mr
<DfsuModelResult>: HD
Time: 2017-10-27 00:00:00 - 2017-10-29 18:00:00
Quantity: Surface Elevation [m]In this case, the track observations are stored in a csv file, which we can read in using pandas. Any file format that can be read into a pandas dataframe can be used here.
df = pd.read_csv('../data/altimetry_NorthSea_20171027.csv',
                  index_col=0, parse_dates=True)
df.head()| lon | lat | surface_elevation | significant_wave_height | wind_speed | |
|---|---|---|---|---|---|
| date | |||||
| 2017-10-26 04:37:37 | 8.757272 | 53.926136 | 1.6449 | 0.426 | 6.100000 |
| 2017-10-26 04:37:54 | 8.221631 | 54.948459 | 1.1200 | 1.634 | 9.030000 |
| 2017-10-26 04:37:55 | 8.189390 | 55.008547 | 1.0882 | 1.717 | 9.370000 |
| 2017-10-26 04:37:56 | 8.157065 | 55.068627 | 1.0309 | 1.869 | 9.559999 |
| 2017-10-26 04:37:58 | 8.124656 | 55.128700 | 1.0369 | 1.939 | 9.980000 |
Csv files have no metadata on which quantity it contains, we add this manually, consistent with the model result, using the TrackObservation class.
o1 = ms.TrackObservation(df, item="surface_elevation", name='alti',
                         quantity=ms.Quantity(name="Surface Elevation", unit="meter"))
o1
/home/runner/work/modelskill/modelskill/src/modelskill/timeseries/_track.py:138: UserWarning: Removed 22 duplicate timestamps with keep=first
warnings.warn(<TrackObservation>: alti
Time: 2017-10-26 04:37:37 - 2017-10-30 20:54:47
Quantity: Surface Elevation [meter]ms.plotting.spatial_overview(o1, mr);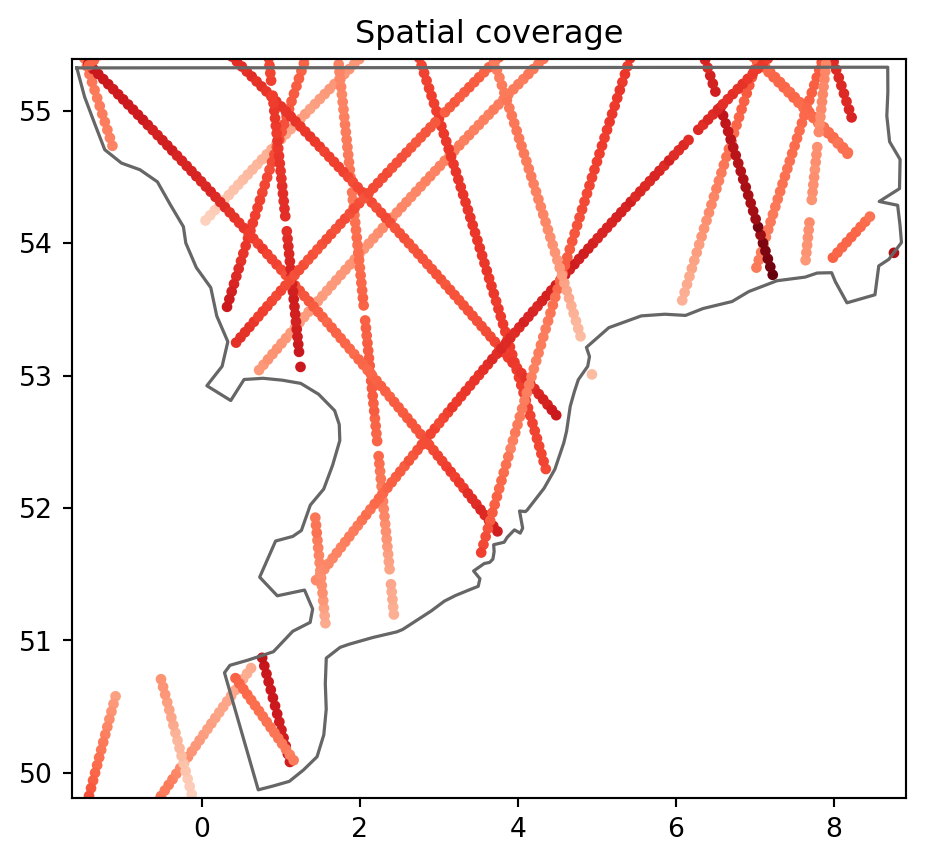
cmp = ms.match(o1, mr)
cmp
<Comparer>
Quantity: Surface Elevation [meter]
Observation: alti, n_points=532
Model(s):
0: HDcmp.plot.scatter();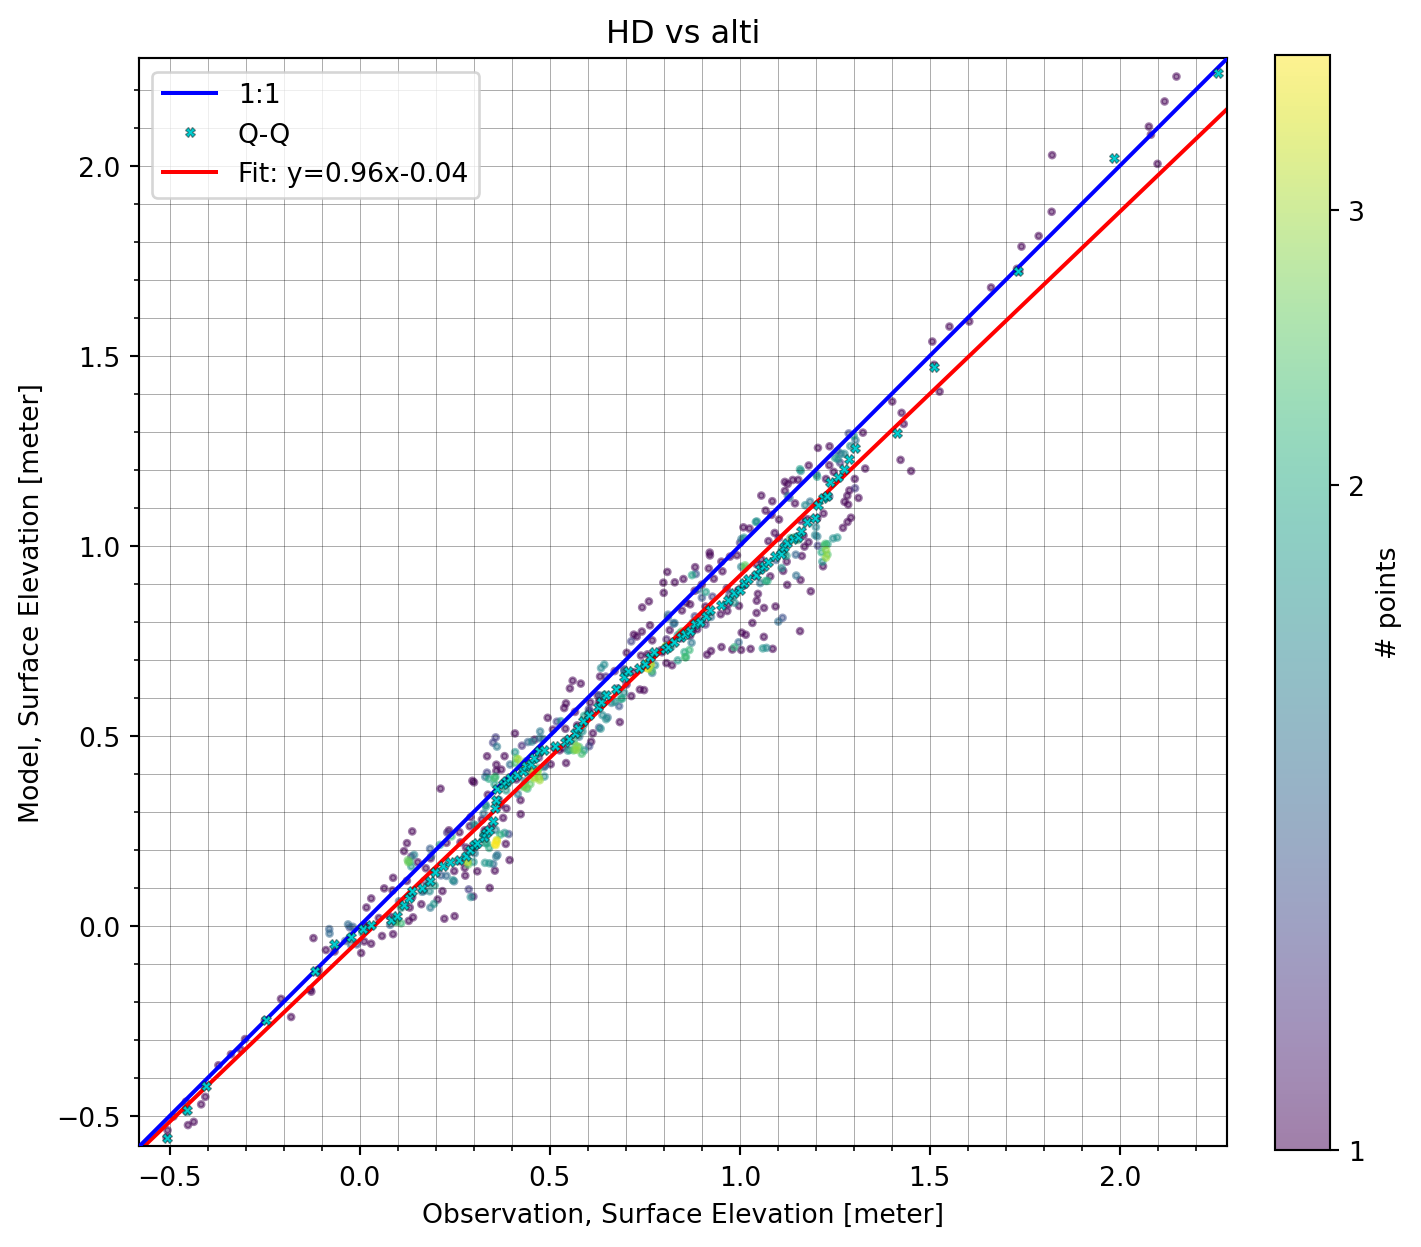
Extract track from dfs0
Using the TrackModelResult class.
mr = ms.TrackModelResult('../data/NorthSeaHD_extracted_track.dfs0',
                          name='HD', item=2)
mr
/home/runner/work/modelskill/modelskill/src/modelskill/timeseries/_track.py:138: UserWarning: Removed 22 duplicate timestamps with keep=first
warnings.warn(<TrackModelResult>: HD
Time: 2017-10-26 04:37:37 - 2017-10-30 20:54:47
Quantity: Undefined [undefined]df = pd.read_csv('../data/altimetry_NorthSea_20171027.csv',
index_col=0, parse_dates=True)
o1 = ms.TrackObservation(df, item=2, name='alti',
quantity=ms.Quantity(name="Surface Elevation", unit="meter"))
o1/home/runner/work/modelskill/modelskill/src/modelskill/timeseries/_track.py:138: UserWarning: Removed 22 duplicate timestamps with keep=first
warnings.warn(<TrackObservation>: alti
Time: 2017-10-26 04:37:37 - 2017-10-30 20:54:47
Quantity: Surface Elevation [meter]cmp = ms.match(o1, mr)
cmp<Comparer>
Quantity: Surface Elevation [meter]
Observation: alti, n_points=532
Model(s):
0: HDcmp.plot.scatter();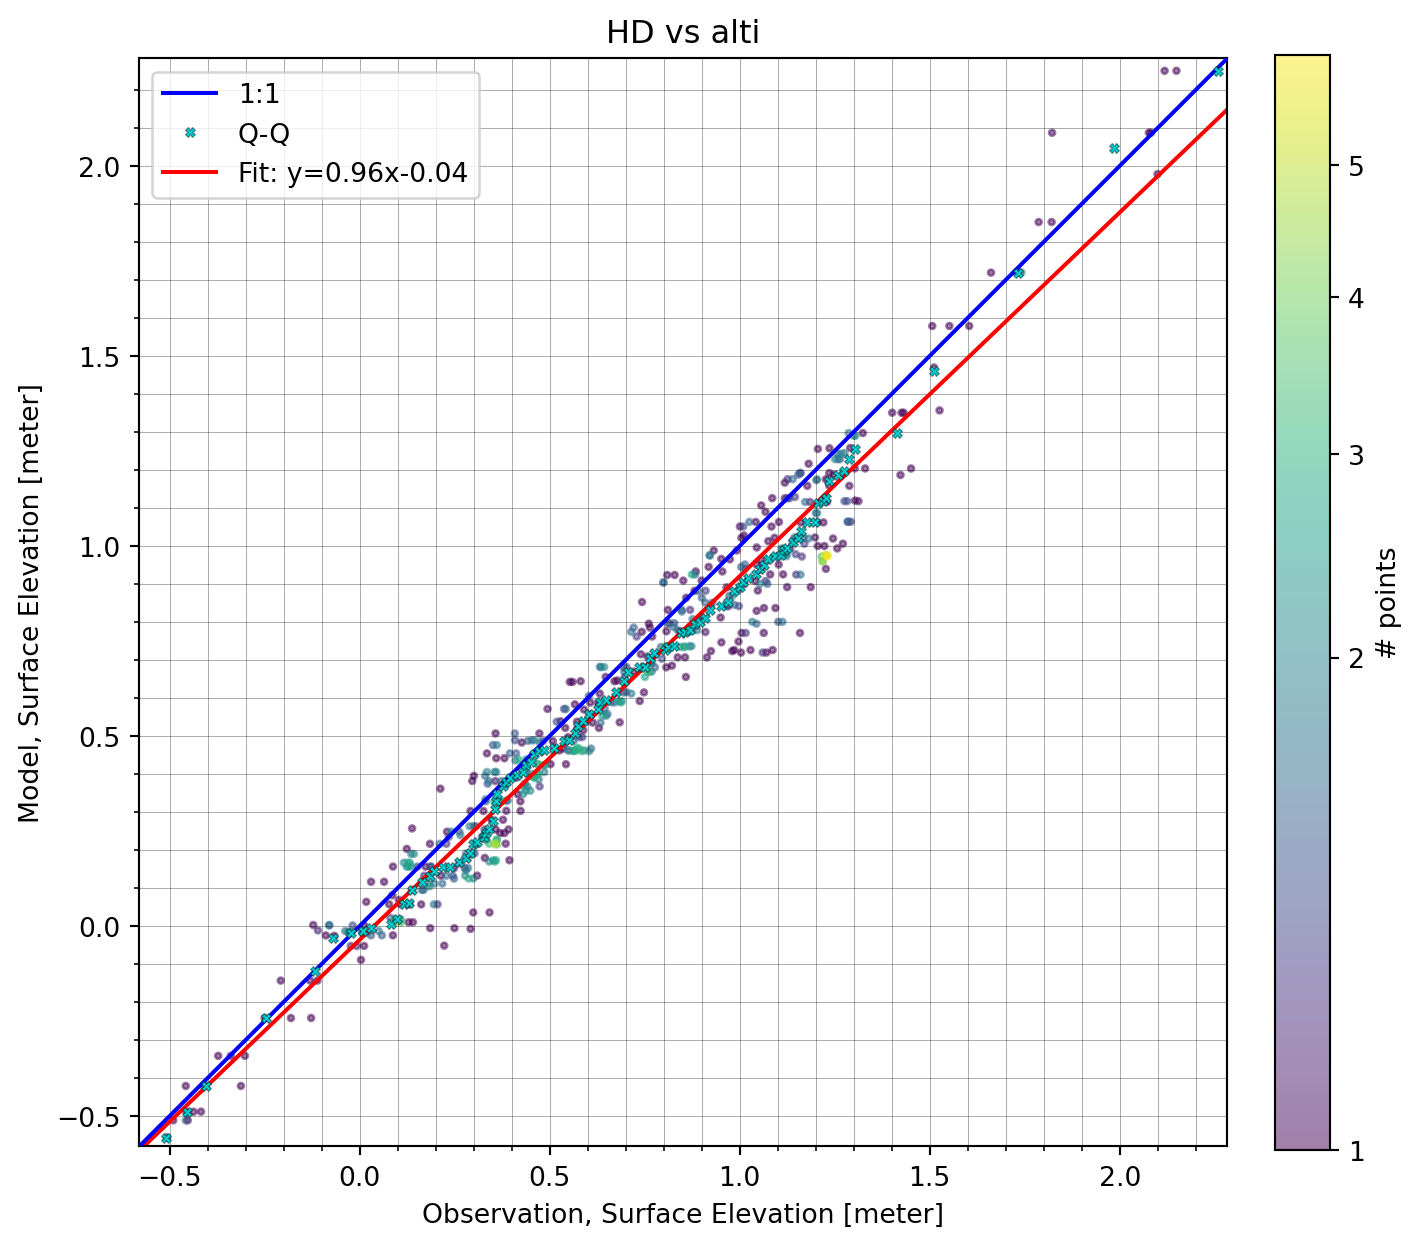
Gridded skill
Load model, load observation, add observation to model and extract.
mr = ms.model_result('../data/NorthSeaHD_and_windspeed.dfsu',
name='HD', item=0)
df = pd.read_csv('../data/altimetry_NorthSea_20171027.csv',
index_col=0, parse_dates=True)
o1 = ms.TrackObservation(df, item=2, name='alti',
quantity=ms.Quantity(name="Surface Elevation", unit="meter"))
cmp = ms.match(o1, mr)
cmp/home/runner/work/modelskill/modelskill/src/modelskill/timeseries/_track.py:138: UserWarning: Removed 22 duplicate timestamps with keep=first
warnings.warn(<Comparer>
Quantity: Surface Elevation [meter]
Observation: alti, n_points=532
Model(s):
0: HDGet metrics binned by a regular spatial grid, returns xarray Dataset
gs = cmp.gridded_skill(metrics=['bias'])
gs
<SkillGrid>
Dimensions: (x: 5, y: 5)fig, axes = plt.subplots(ncols=2, nrows=1, figsize = (10, 5))
gs.n.plot(ax=axes[0])
gs.bias.plot(ax=axes[1]);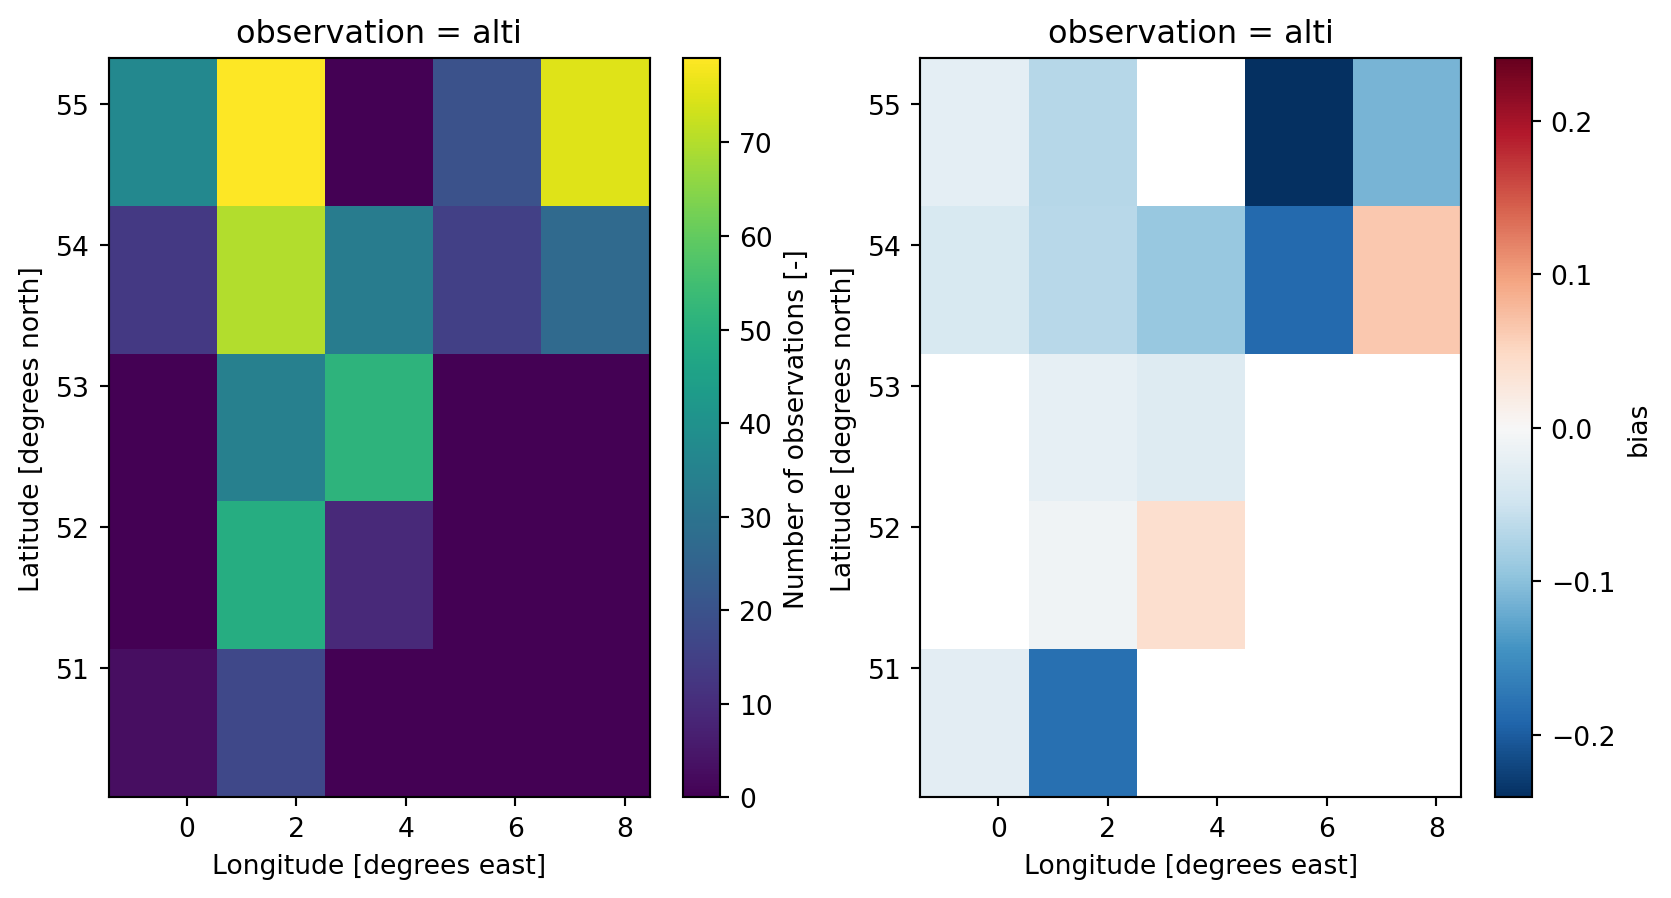
Minimum number of observations
gs = cmp.gridded_skill(metrics=['bias'], n_min=25)
fig, axes = plt.subplots(ncols=2, nrows=1, figsize=(10, 5))
gs.n.plot(ax=axes[0])
gs.bias.plot(ax=axes[1]);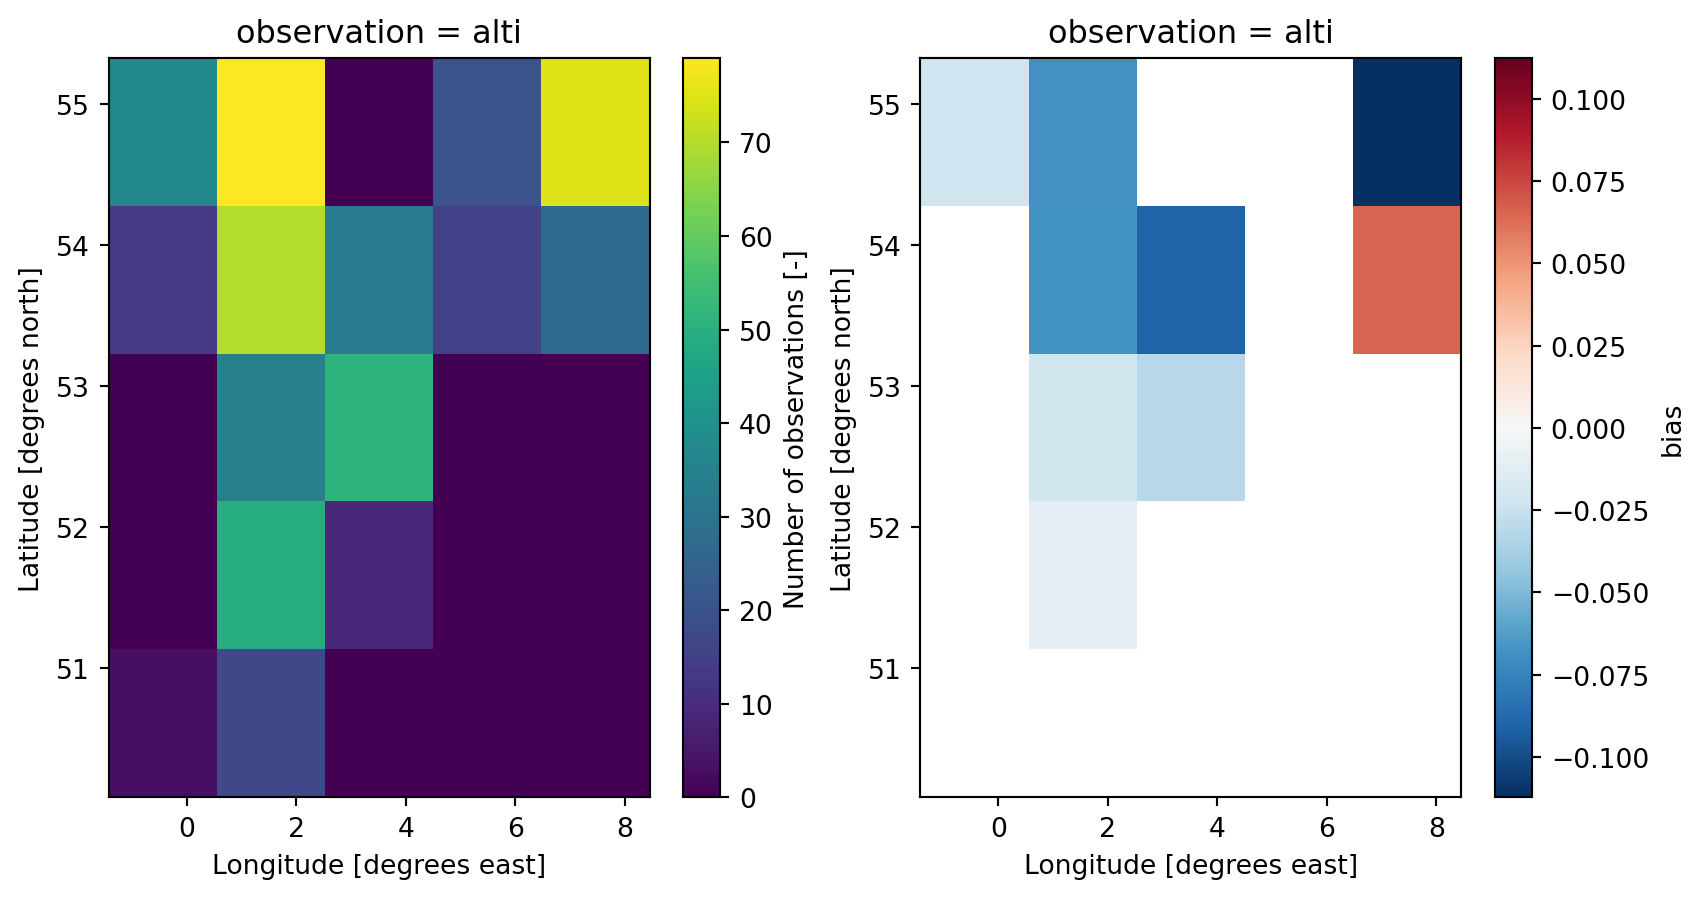
Multiple bins - gridded skill for water level categories
Get data from comparer as dataframe and add a water level category as a new column.
dftmp = cmp.data.to_dataframe()
dftmp["wl category"] = 'high'
dftmp.loc[dftmp['HD']<0, "wl category"] = 'low'
Add the “wl category” to the comparer’s data structure.
cmp.data["wl category"] = dftmp["wl category"]Now aggregate the data by the new column (and x and y):
gs = cmp.gridded_skill(by=['wl category'], metrics=['bias'], n_min=5)
gs
<SkillGrid>
Dimensions: (x: 5, y: 5)gs.bias.plot();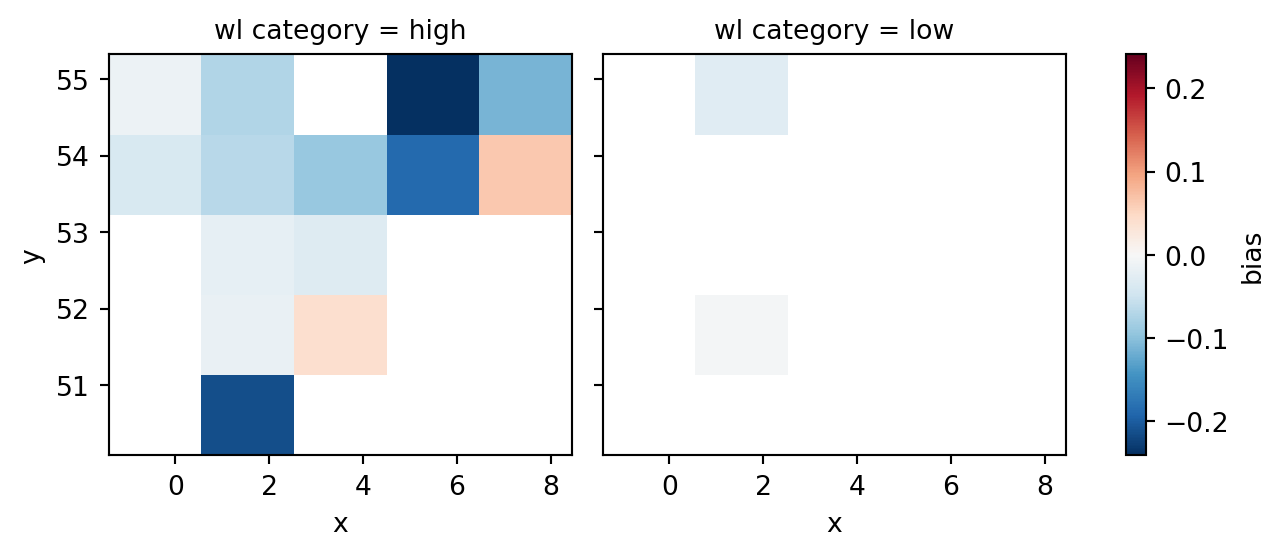
Multiple observations
Add fake 2nd observation to model
import warnings

df2 = df.copy()
df2['surface_elevation'] = df2['surface_elevation'] - 0.2
o2 = ms.TrackObservation(df2, item=2, name='alti2')

warnings.filterwarnings('ignore', message="duplicate")
cmp2 = ms.match(o2, mr)
/home/runner/work/modelskill/modelskill/src/modelskill/timeseries/_track.py:138: UserWarning: Removed 22 duplicate timestamps with keep=first
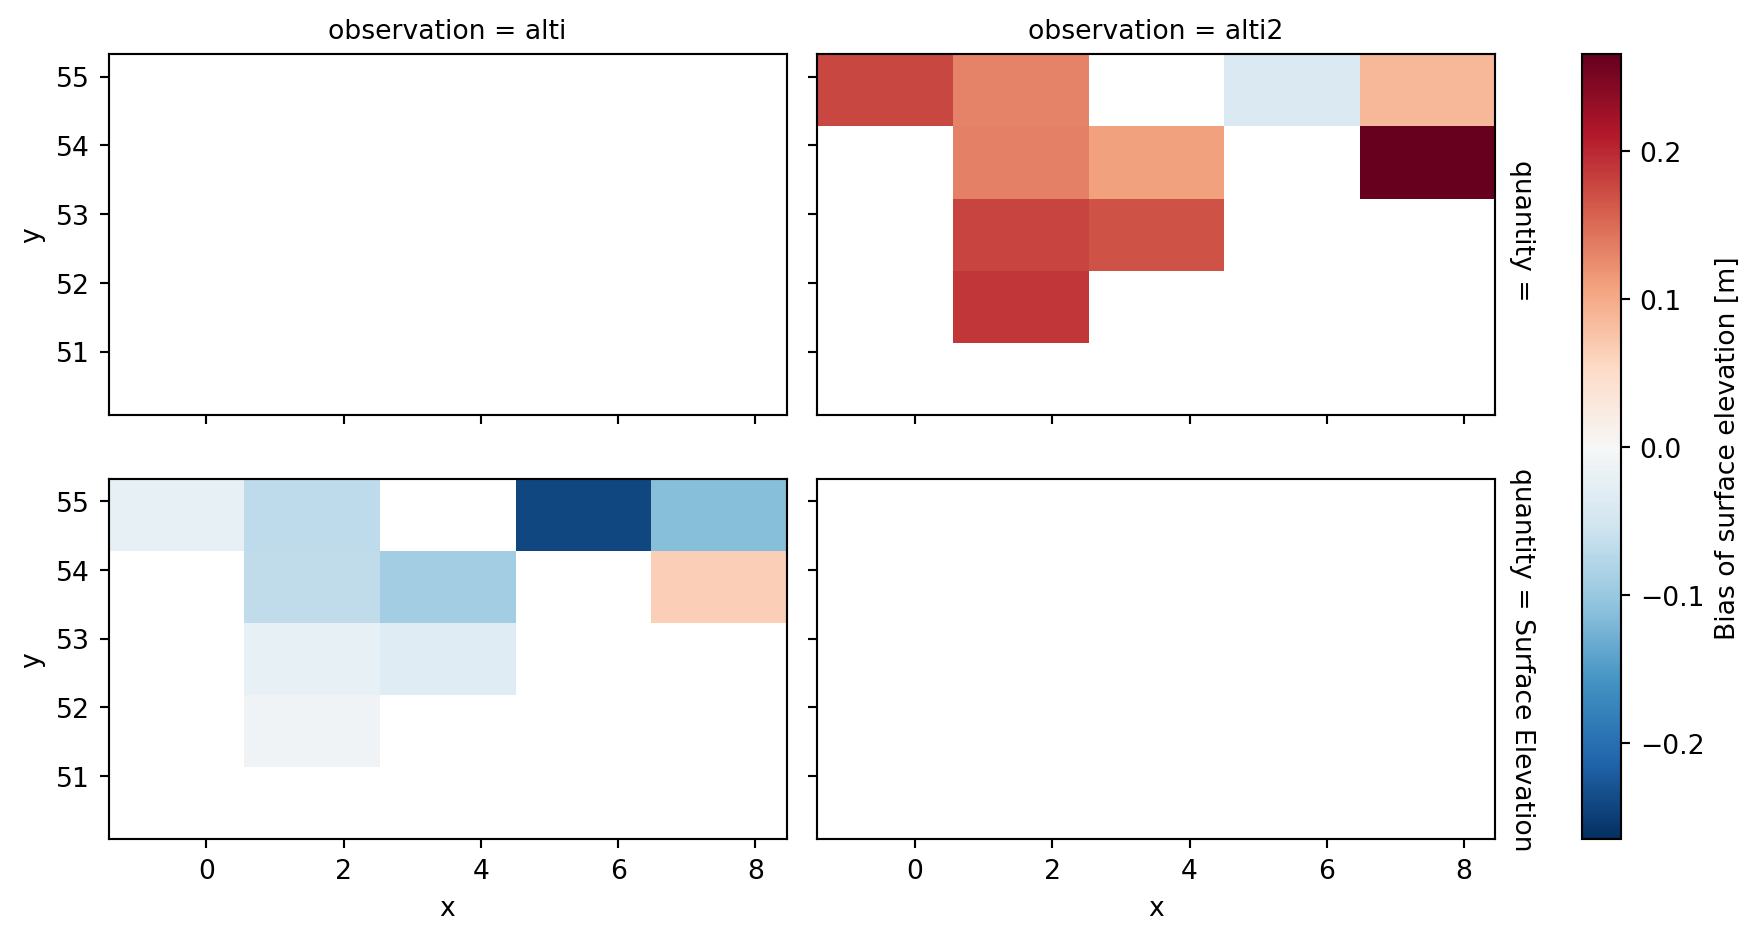
warnings.warn(Extract, gridded skill, add attrs, plot.
cmp = cmp.merge(cmp2)
gs = cmp.gridded_skill(metrics=['bias'], n_min=20)
gs.bias.data.attrs = dict(long_name="Bias of surface elevation", units="m")
gs.bias.plot(figsize=(10,5));