import xarray as xr
import modelskill as msGridded NetCDF modelresults
2D modelresults stored in NetCDF or Grib can be loaded to ModelSkill using xarray. In this way, MIKE 21 modelresults in dfsu format can easily be compared to model results from third party providers often stored in NetCDF.
Observations
o1 = ms.PointObservation('../data/SW/HKNA_Hm0.dfs0', item=0, x=4.2420, y=52.6887, name="HKNA")
o2 = ms.PointObservation("../data/SW/eur_Hm0.dfs0", item=0, x=3.2760, y=51.9990, name="EPL")
o3 = ms.TrackObservation("../data/SW/Alti_c2_Dutch.dfs0", item=3, name="c2")
MIKE ModelResult
mrMIKE = ms.model_result('../data/SW/HKZN_local_2017_DutchCoast.dfsu', name='MIKE21SW', item=0)NetCDF ModelResult
fn = "../data/SW/ERA5_DutchCoast.nc"
xr.open_dataset(fn)
<xarray.Dataset> Size: 590kB
Dimensions: (time: 67, latitude: 11, longitude: 20)
Coordinates:
* time (time) datetime64[ns] 536B 2017-10-27 ... 2017-10-29T18:00:00
* latitude (latitude) float32 44B 55.0 54.5 54.0 53.5 ... 51.0 50.5 50.0
* longitude (longitude) float32 80B -1.0 -0.5 0.0 0.5 1.0 ... 7.0 7.5 8.0 8.5
Data variables:
mwd (time, latitude, longitude) float64 118kB ...
mwp (time, latitude, longitude) float64 118kB ...
mp2 (time, latitude, longitude) float64 118kB ...
pp1d (time, latitude, longitude) float64 118kB ...
swh (time, latitude, longitude) float64 118kB ...
Attributes:
Conventions: CF-1.6
history: 2021-06-07 12:25:02 GMT by grib_to_netcdf-2.16.0: /opt/ecmw...mrERA5 = ms.model_result(fn, item="swh", name='ERA5')mrERA5<GridModelResult>: ERA5
Time: 2017-10-27 00:00:00 - 2017-10-29 18:00:00
Quantity: Significant height of combined wind waves and swell [m]mrERA5.data # mr contains the xr.Dataset<xarray.Dataset> Size: 119kB
Dimensions: (time: 67, y: 11, x: 20)
Coordinates:
* time (time) datetime64[ns] 536B 2017-10-27 ... 2017-10-29T18:00:00
* y (y) float32 44B 55.0 54.5 54.0 53.5 53.0 ... 51.5 51.0 50.5 50.0
* x (x) float32 80B -1.0 -0.5 0.0 0.5 1.0 1.5 ... 6.5 7.0 7.5 8.0 8.5
Data variables:
swh (time, y, x) float64 118kB ...
Attributes:
Conventions: CF-1.6
history: 2021-06-07 12:25:02 GMT by grib_to_netcdf-2.16.0: /opt/ecmw...Test extract from XArray
- Extract point
- Extract track
mrERA5.extract(o1, spatial_method="nearest").data.head()<xarray.Dataset> Size: 104B
Dimensions: (time: 5)
Coordinates:
* time (time) datetime64[ns] 40B 2017-10-27 ... 2017-10-27T04:00:00
x float64 8B 4.242
y float64 8B 52.69
z object 8B None
Data variables:
ERA5 (time) float64 40B 1.22 1.347 1.466 1.612 1.793
Attributes:
gtype: point
modelskill_version: 1.4.0a3mrERA5.extract(o3).data.head()<xarray.Dataset> Size: 168B
Dimensions: (time: 5)
Coordinates:
* time (time) datetime64[ns] 40B 2017-10-27T12:52:52.337000 ... 2017-10...
x (time) float64 40B 2.423 2.414 2.405 2.396 2.387
y (time) float64 40B 51.25 51.31 51.37 51.42 51.48
z float64 8B nan
Data variables:
ERA5 (time) float64 40B 1.439 1.464 1.489 1.514 1.538
Attributes:
gtype: track
modelskill_version: 1.4.0a3Multi-file ModelResult
Use mfdataset to load multiple files as a single ModelResult.
fn = "../data/SW/CMEMS_DutchCoast_*.nc"
mrCMEMS = ms.model_result(fn, item="VHM0", name='CMEMS')
mrCMEMS
<GridModelResult>: CMEMS
Time: 2017-10-28 00:00:00 - 2017-10-29 18:00:00
Quantity: Spectral significant wave height (Hm0) [m]Connect multiple models and observations and extract
ms.plotting.temporal_coverage(obs=[o1,o2,o3], mod=[mrERA5, mrCMEMS, mrMIKE])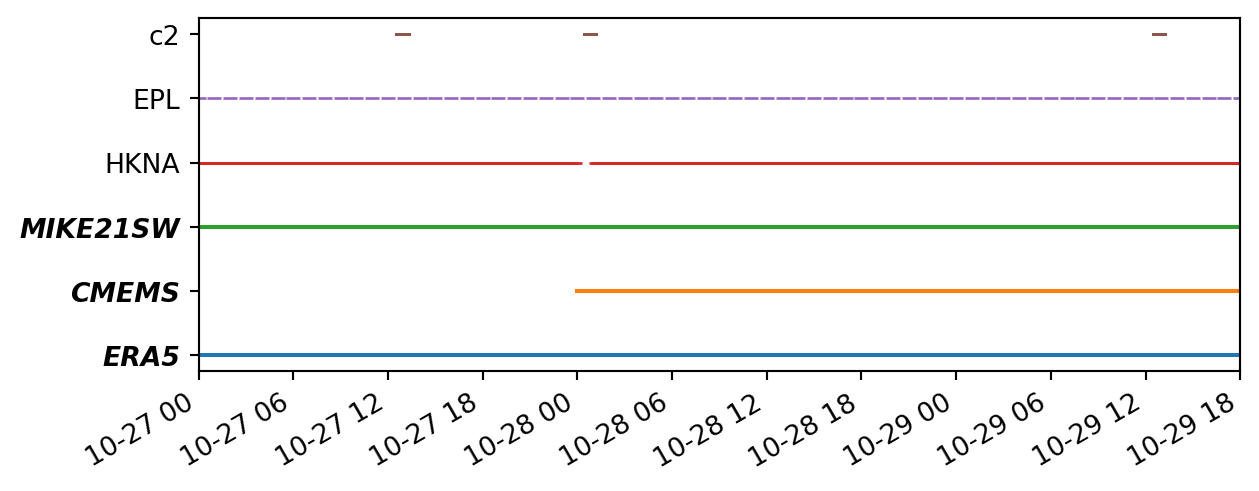
# o1 is slightly outside the model domain of mrERA5,
# we therefore use "nearest" instead of the default spatial interpolation method
cc = ms.match(
    obs=[o1, o2, o3],
    mod=[mrERA5, mrCMEMS, mrMIKE],
    spatial_method='nearest',
)
Analysis and plotting
Which model is better?
sk = cc.skill()
sk.swaplevel().sort_index(level="observation").style()| n | bias | rmse | urmse | mae | cc | si | r2 | ||
|---|---|---|---|---|---|---|---|---|---|
| observation | model | ||||||||
| EPL | CMEMS | 43 | -0.441 | 0.519 | 0.273 | 0.443 | 0.920 | 0.090 | 0.445 |
| ERA5 | 43 | -0.247 | 0.335 | 0.226 | 0.269 | 0.948 | 0.074 | 0.769 | |
| MIKE21SW | 43 | -0.078 | 0.205 | 0.189 | 0.174 | 0.973 | 0.062 | 0.913 | |
| HKNA | CMEMS | 242 | -0.742 | 0.882 | 0.476 | 0.742 | 0.903 | 0.128 | 0.222 |
| ERA5 | 242 | -0.551 | 0.654 | 0.352 | 0.556 | 0.954 | 0.094 | 0.572 | |
| MIKE21SW | 242 | -0.230 | 0.411 | 0.341 | 0.296 | 0.949 | 0.092 | 0.831 | |
| c2 | CMEMS | 36 | -0.200 | 0.412 | 0.360 | 0.339 | 0.930 | 0.093 | 0.807 |
| ERA5 | 36 | -0.540 | 0.653 | 0.368 | 0.573 | 0.951 | 0.095 | 0.513 | |
| MIKE21SW | 36 | 0.315 | 0.405 | 0.254 | 0.349 | 0.962 | 0.065 | 0.813 |
sk["urmse"].plot.bar(figsize=(6,3));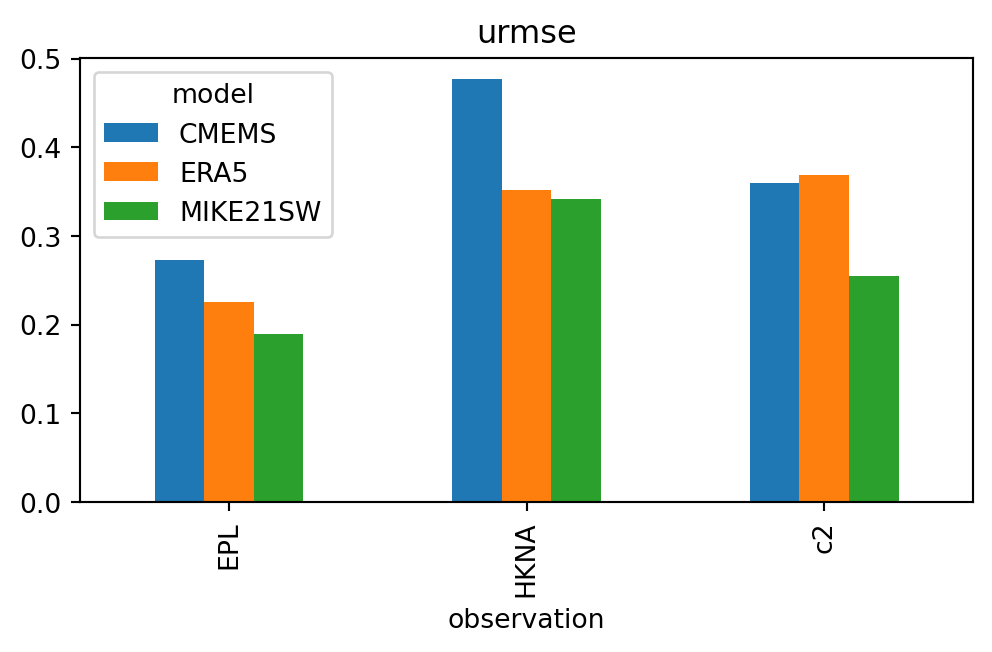
cc.mean_skill().style()| n | bias | rmse | urmse | mae | cc | si | r2 | |
|---|---|---|---|---|---|---|---|---|
| model | ||||||||
| CMEMS | 321 | -0.461 | 0.604 | 0.370 | 0.508 | 0.918 | 0.103 | 0.491 |
| ERA5 | 321 | -0.446 | 0.547 | 0.315 | 0.466 | 0.951 | 0.088 | 0.618 |
| MIKE21SW | 321 | 0.002 | 0.340 | 0.262 | 0.273 | 0.962 | 0.073 | 0.852 |
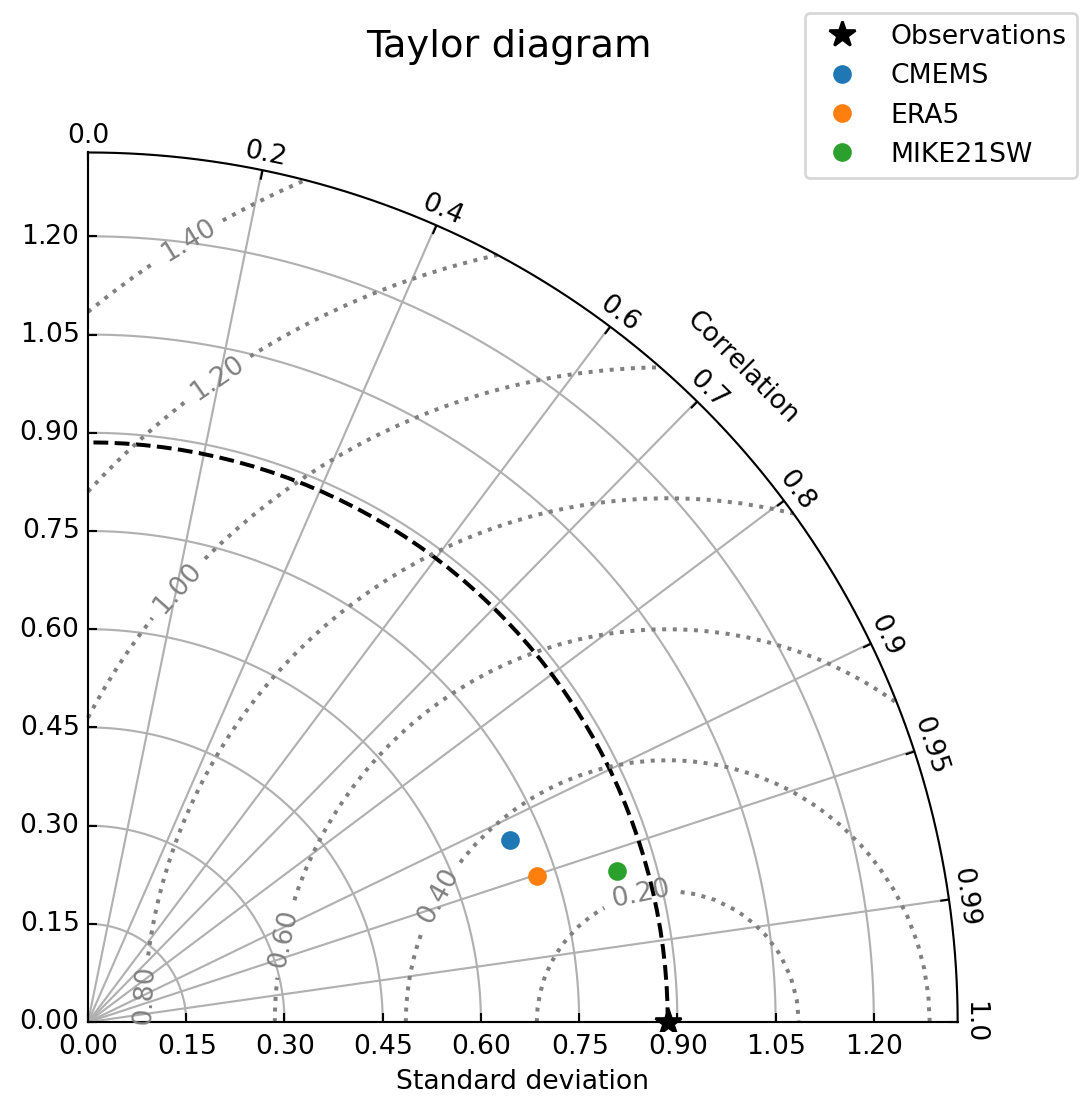
cc.plot.taylor(figsize=(6,6))