import pandas as pd
from tsod import RangeDetector
rd = RangeDetector(max_value=2.0)
data = pd.Series([0.0, 1.0, 3.0]) # 3.0 is out of range i.e. an anomaly
anom = rd.detect(data)
anom
0 False
1 False
2 True
Name: 0, dtype: bool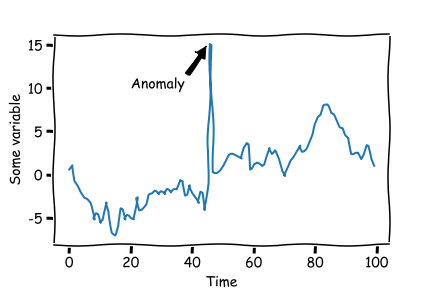
Sensors often provide faulty or missing observations. These anomalies must be detected automatically and replaced with more feasible values before feeding the data to numerical simulation engines as boundary conditions or real time decision systems.
This package aims to provide examples and algorithms for detecting anomalies in time series data specifically tailored to DHI users and the water domain. It is simple to install and deploy operationally and is accessible to everyone (open-source).
tsod is library for timeseries data. The format of a timeseries is always a pandas.Series and in some cases with a pandas.DatetimeIndex
pandas.Series (see Data formats below)RangeDetector or ConstantValueDetectorimport pandas as pd
from tsod import RangeDetector
rd = RangeDetector(max_value=2.0)
data = pd.Series([0.0, 1.0, 3.0]) # 3.0 is out of range i.e. an anomaly
anom = rd.detect(data)
anom0 False
1 False
2 True
Name: 0, dtype: booldata[anom] # get anomalous data2 3.0
dtype: float64data[~anom] # get normal data0 0.0
1 1.0
dtype: float64Save a configured detector
cd = CombinedDetector([ConstantValueDetector(), RangeDetector()])
cd.fit(normal_data)
cd.save("detector.joblib")
… and then later load it from disk
my_detector = tsod.load("detector.joblib")
my_detector.detect(some_data)