import matplotlib.pyplot as plt
import numpy as np

import mikeioVertical profile
Show a vertical profile dfsu on a map, mark positions along it and subset it by distance.
A vertical profile (2DV) dfsu is a transect with depth, typically written by a MIKE 3 model. This example places a profile on the model domain, marks points of interest along it, and cuts out part of it.
Profile on the model domain
ds = mikeio.read("../../data/oresund_vertical_slice.dfsu")
g = ds.geometry
model_domain = mikeio.open("../../data/oresundHD_run1.dfsu").geometry

_, ax = plt.subplots(1, 2, figsize=(12, 4))
model_domain.plot(ax=ax[0], title="Transect")
g.plot(color="r", ax=ax[0])
g.plot.mesh(ax=ax[1], title="Transect mesh");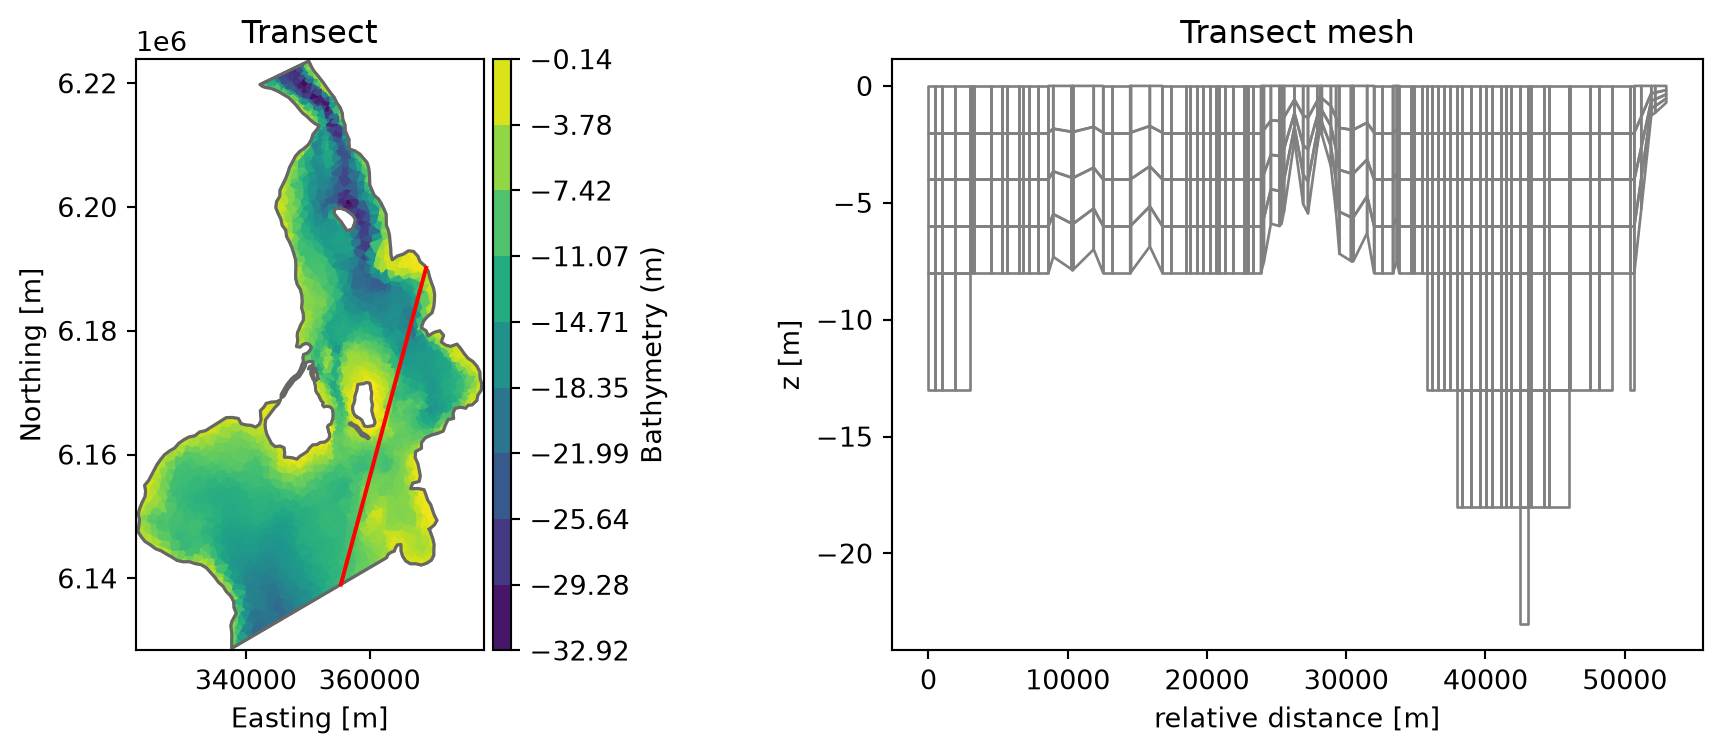
Marking positions along the profile
The x-axis of a profile plot is the distance along the transect. get_nearest_relative_distance converts a map position to that distance, so points of interest can be marked on both plots:
ptA = (3.55e05, 6.145e06)
ptB = (3.62e05, 6.166e06)
distA = g.get_nearest_relative_distance(ptA)
distB = g.get_nearest_relative_distance(ptB)

_, ax = plt.subplots(1, 2, figsize=(12, 4))
model_domain.plot(ax=ax[0], title="Transect")
g.plot(color="r", ax=ax[0])
for pt, dist, label in [(ptA, distA, "A"), (ptB, distB, "B")]:
    ax[0].plot(*pt, color="b", marker="*", markersize=10)
    ax[1].axvline(dist, color="0.5")
    ax[1].text(dist + 500, -20, f"position {label}")
ds["Temperature"].isel(time=2).plot(ax=ax[1]);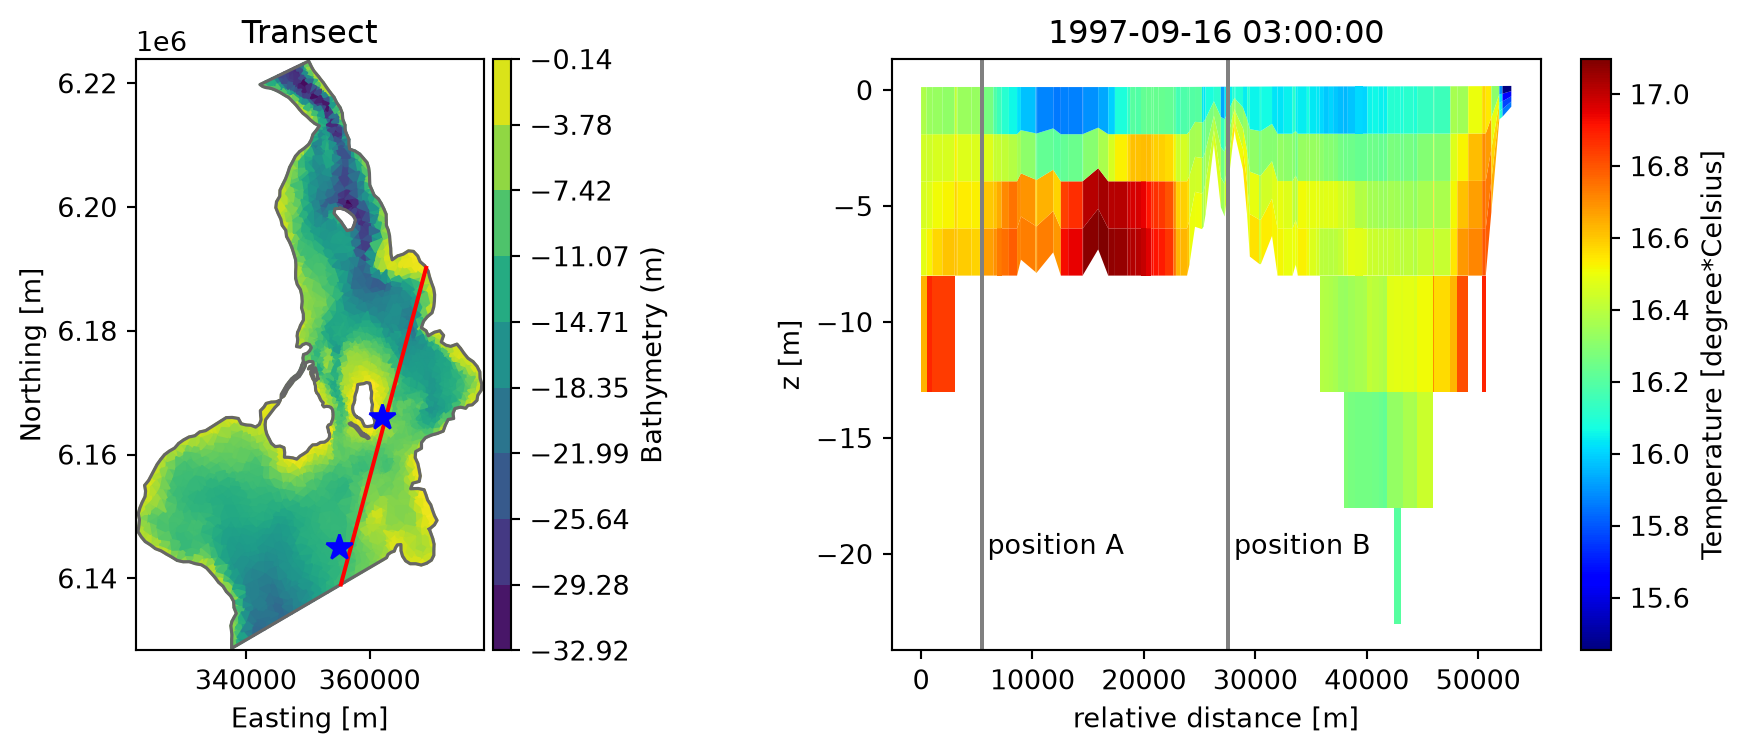
Subsetting by distance
relative_element_distance holds the distance of each element along the profile. Select the part between 10 and 25 km:
rd = g.relative_element_distance
idx = np.where((rd > 10_000) & (rd < 25_000))[0]
ds_sub = ds.isel(element=idx)
ds_sub["Temperature"].isel(time=-1).plot();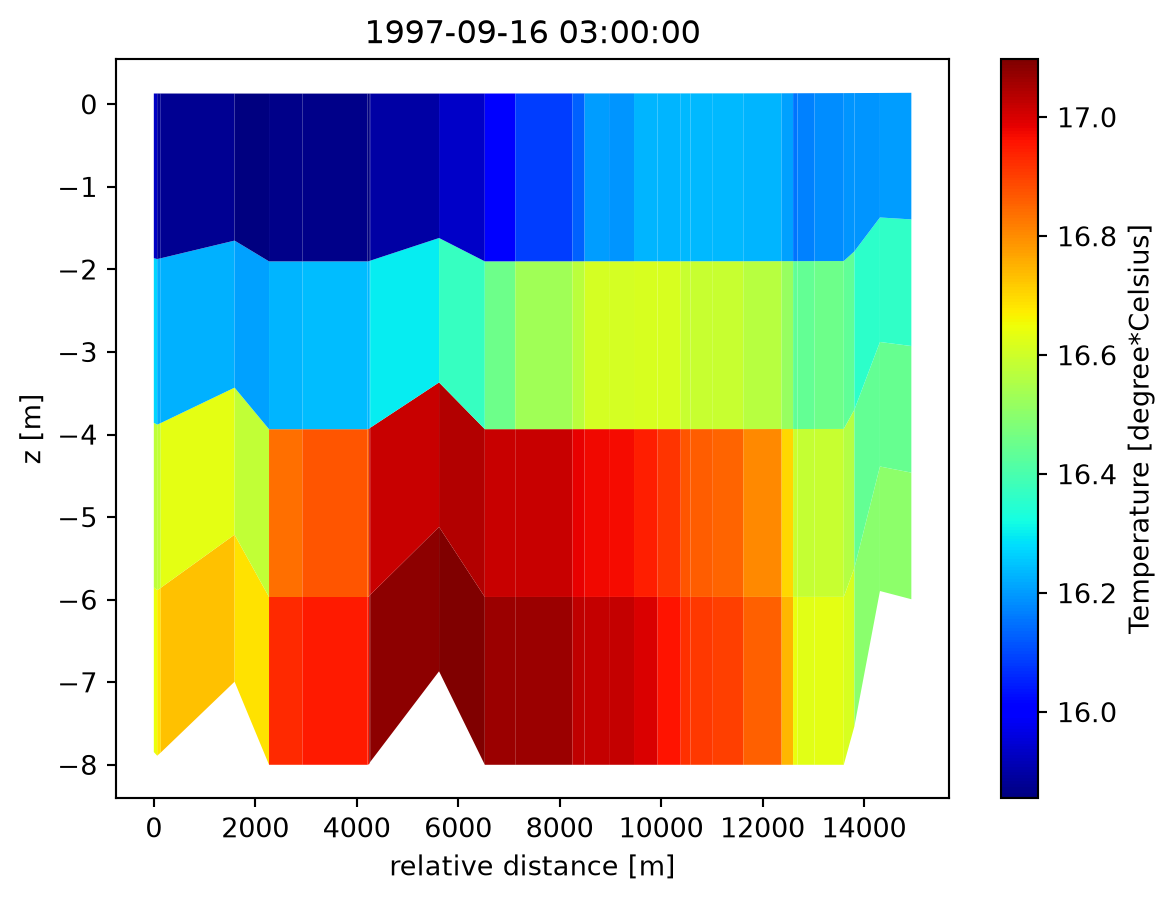
A bent profile in geographical coordinates
A profile need not be straight. This one follows a curved path near Kalundborg, in longitude/latitude:
ds = mikeio.read("../../data/kalundborg_transect.dfsu")
model_domain = mikeio.open("../../data/kalundborg_coarse.mesh").geometry

ax = model_domain.plot.outline()
ds.geometry.plot(color="cyan", ax=ax);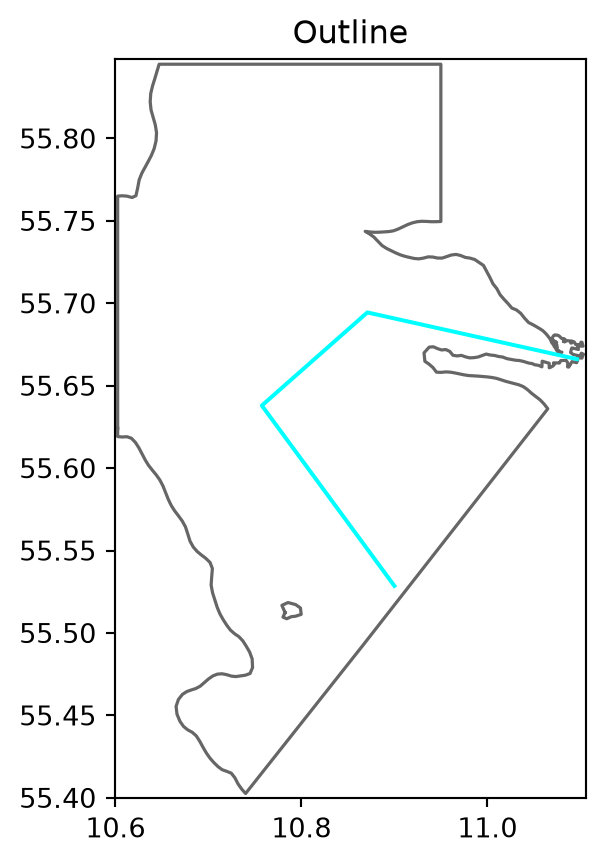
ds["U velocity"].isel(time=-1).plot(figsize=(12, 4));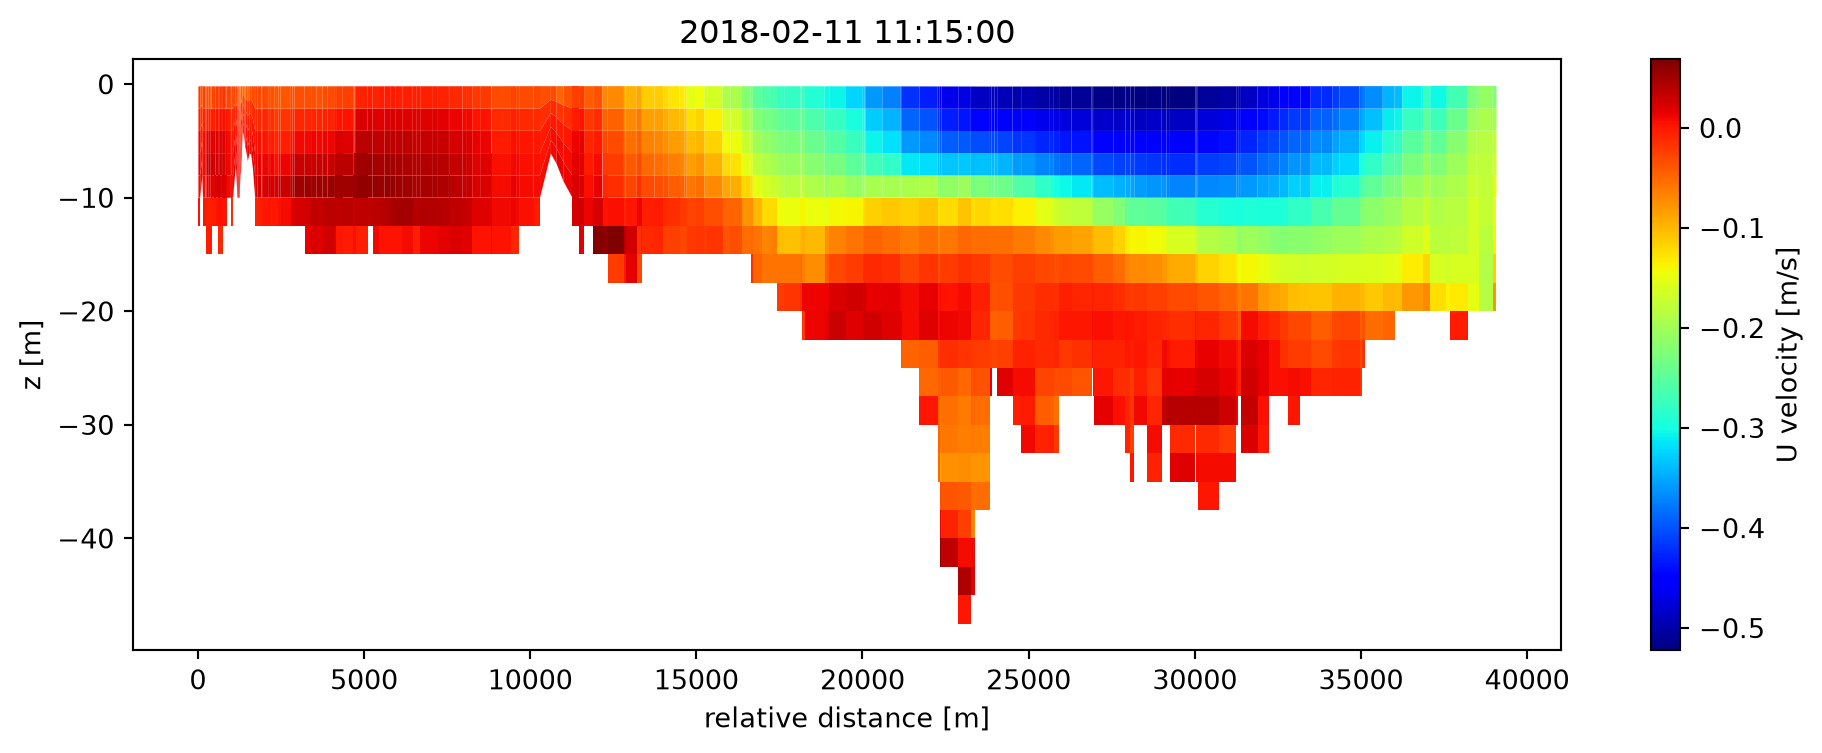
A single column, one line per time step:
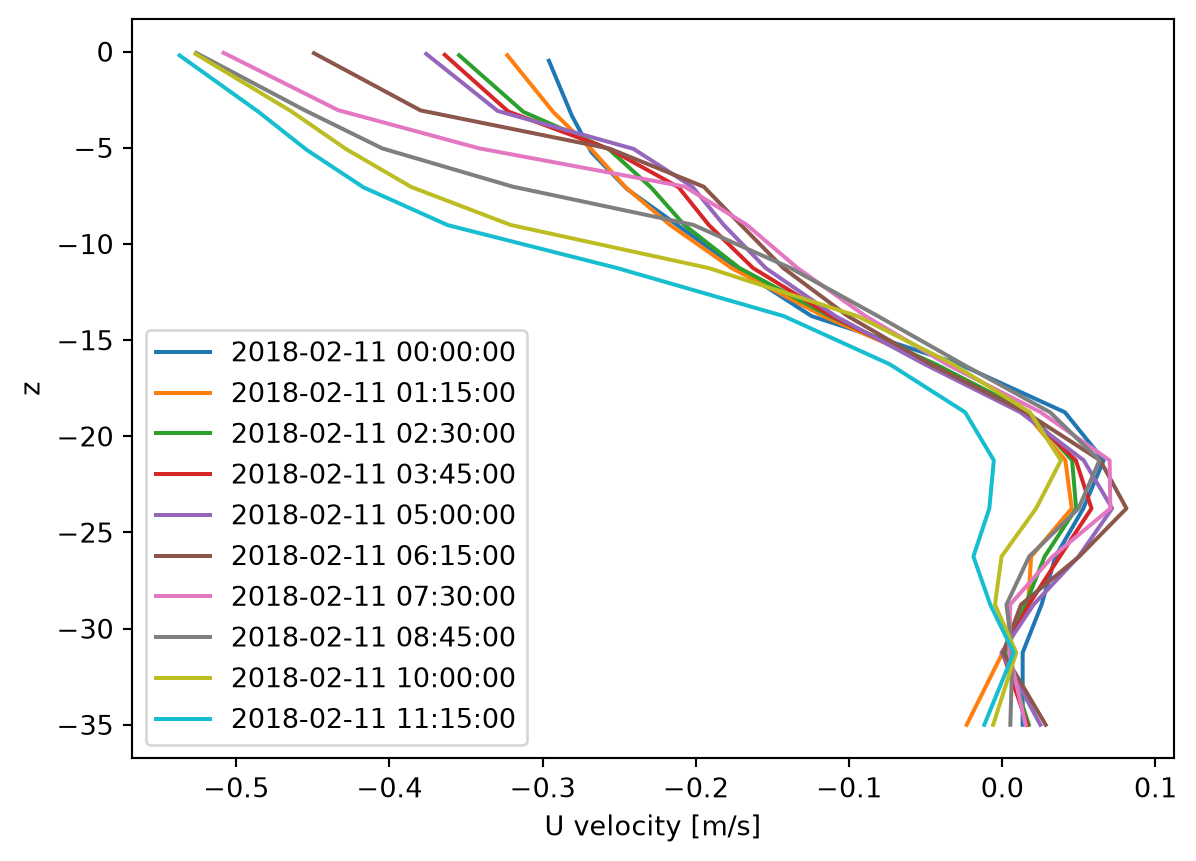
ds.sel(x=10.8, y=55.6)["U velocity"].plot()
plt.legend(ds.time);