import matplotlib as mpl
import matplotlib.pyplot as plt
import numpy as np
import mikeioDfs2 - Snow cover comparison
Compare MIKE SHE and MODIS snow cover from two Dfs2 files
This example compares snow cover data from a MIKE SHE model simulation with MODIS satellite observations stored in two separate Dfs2 files. A simple differencing approach highlights areas where the model and observations agree or disagree.
Read the data
mshe_ds = mikeio.read("../../data/MikeSheExtract.dfs2")
mshe_ds
<mikeio.Dataset>
dims: (time:3, y:161, x:192)
time: 2018-01-28 00:00:00 - 2018-02-11 00:00:00 (3 records)
geometry: Grid2D (ny=161, nx=192)
items:
0: Total Snow storage <Storage depth> (millimeter)
1: Wet Snow storage Fraction <Fraction> ( )
2: Fraction of cell area covered by Snow <Fraction> ( )
3: Precipitation + Irrigation added to Snow <Precipitation Rate> (mm per day) - MeanStepBackward
4: Total Snow converted to Overland Flow <Precipitation Rate> (mm per day) - MeanStepBackward
5: Freezing due to Air temperature <Storage Change Rate> (mm per day) - MeanStepBackward
6: Melting due to Air temperature <Storage Change Rate> (mm per day) - MeanStepBackward
7: Melting due to SW Solar Radiation <Storage Change Rate> (mm per day) - MeanStepBackward
8: Melting due to energy in Rain <Storage Change Rate> (mm per day) - MeanStepBackward
9: Snow evaporation <Evapotranspiration Rate> (mm per day) - MeanStepBackwardmodis_ds = mikeio.read("../../data/ModisExtract.dfs2")
modis_ds<mikeio.Dataset>
dims: (time:15, y:161, x:192)
time: 2018-01-28 00:00:00 - 2018-02-11 00:00:00 (15 records)
geometry: Grid2D (ny=161, nx=192)
items:
0: Snow Cover <Snow Cover Percentage> (percent)The MIKE SHE file has 3 timesteps with multiple snow-related items, while MODIS has 15 timesteps with a single snow cover percentage item.
Select matching timesteps
mshe_snow = mshe_ds["Fraction of cell area covered by Snow"].isel(time=0)
modis_snow = modis_ds["Snow Cover"].isel(time=0) / 100.0  # convert % to fraction
Use NaN values from MIKE SHE to mask the MODIS data to the catchment boundary:
modis_snow.values = np.where(
    np.isnan(mshe_snow.values),
    mshe_snow.values,
    modis_snow.values,
)
Compare snow cover
modis_snow.plot(vmin=0.0, vmax=1.0, cmap="jet", label="Fraction")
plt.title("MODIS");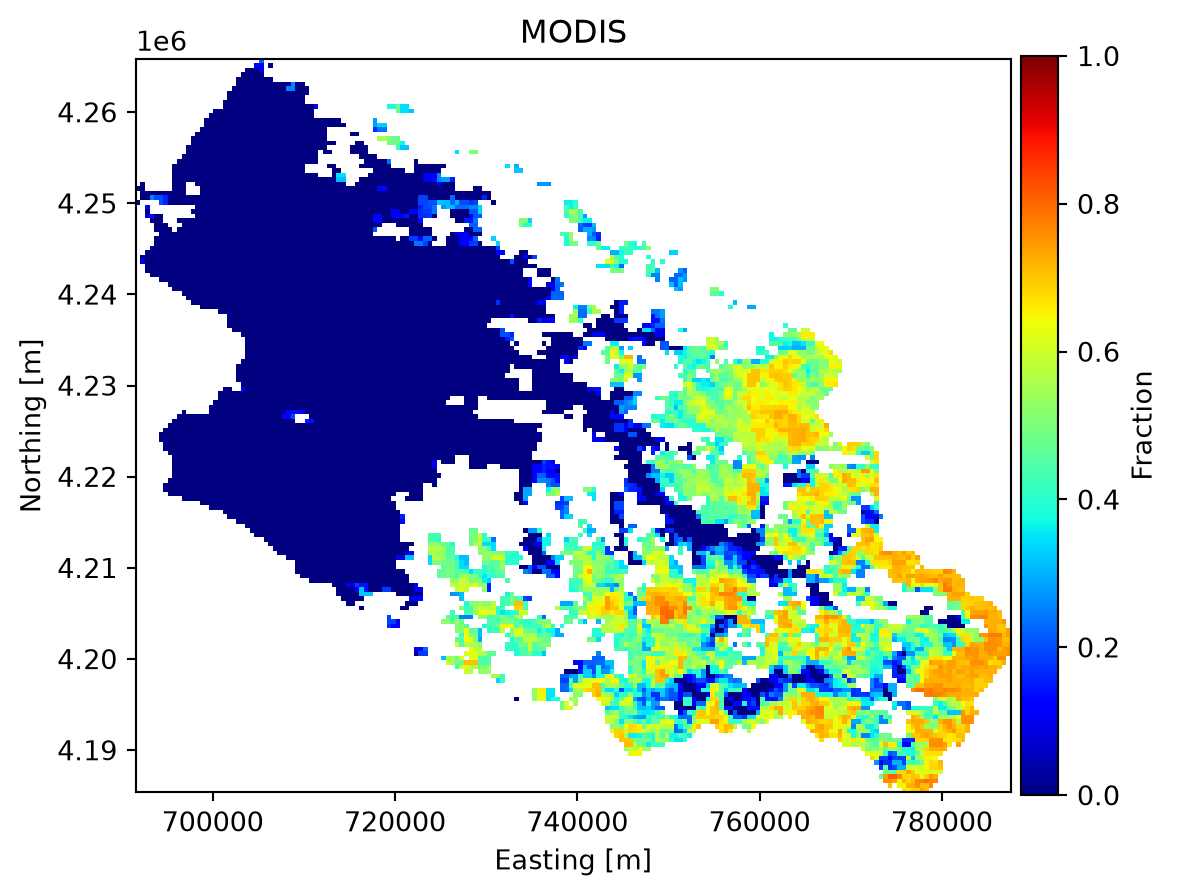
mshe_snow.plot(vmin=0.0, vmax=1.0, cmap="jet", label="Fraction")
plt.title("MIKE SHE");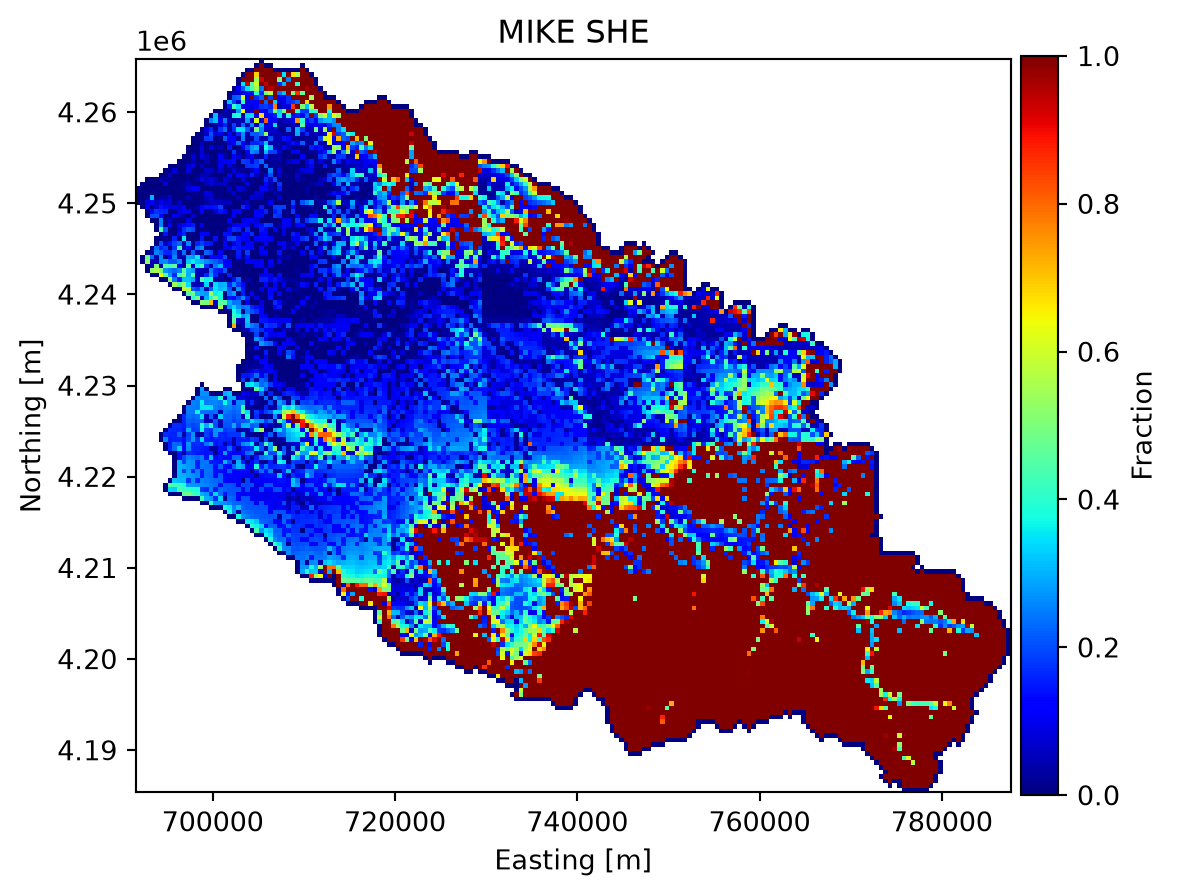
Difference
diff = modis_snow.copy()
diff.values = modis_snow.values - mshe_snow.values

colors = ["yellow", "green", "red"]
boundaries = [-1.0, -0.1, 0.1, 1.0]
cmap = mpl.colors.ListedColormap(colors)
norm = mpl.colors.BoundaryNorm(boundaries, cmap.N)

diff.plot(cmap=cmap, norm=norm, figsize=(7, 5))
plt.title("Difference (MODIS − MIKE SHE)");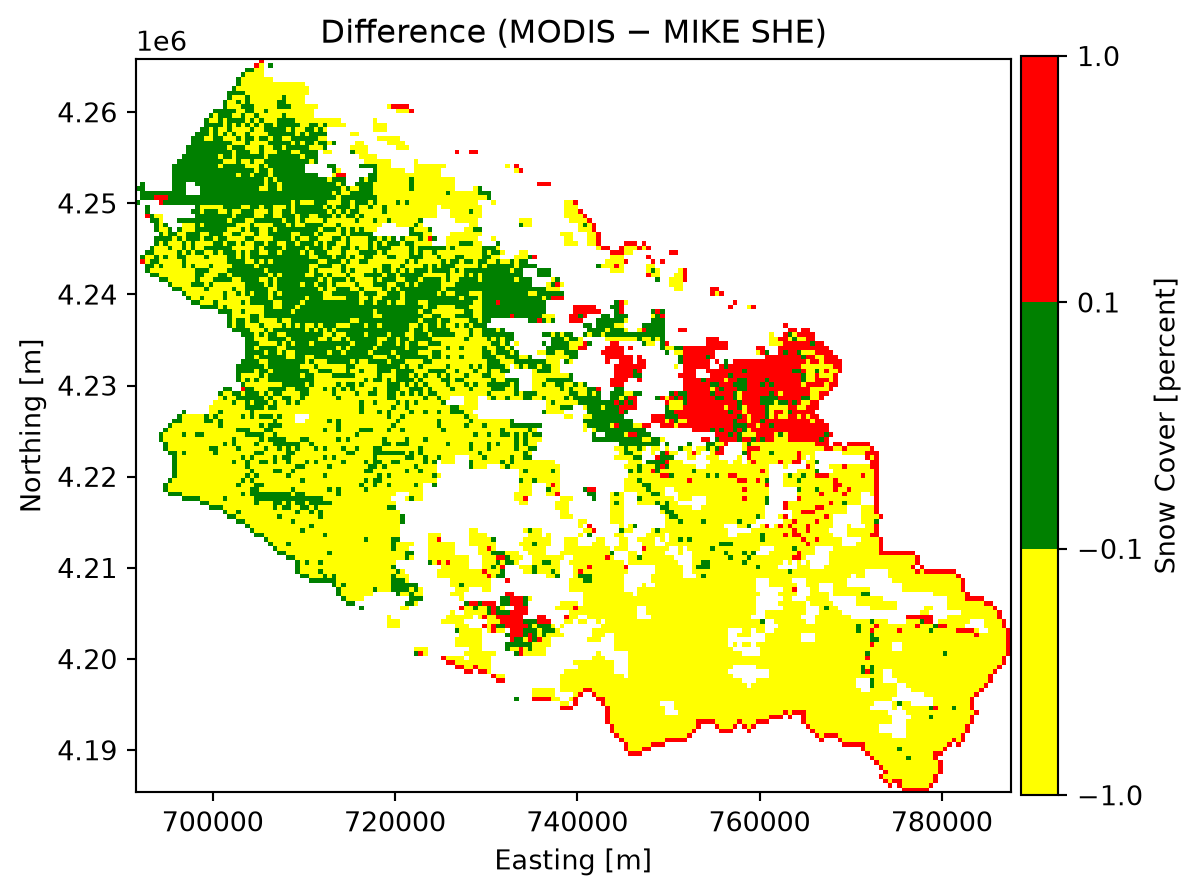
- Yellow: MIKE SHE predicts more snow than MODIS observes (diff < −0.1)
- Green: Model and observations agree within ±0.1
- Red: MODIS observes more snow than MIKE SHE predicts (diff > 0.1)