import mikeioDfs0 - Relative time axis
MIKE IO uses a pandas DatetimeIndex to represent the time dimension in dfs files. If the dfs file has a relative time axis, it will be represented as a pandas TimedeltaIndex.
ds = mikeio.read("../../data/eq_relative.dfs0")
ds
<mikeio.Dataset>
title: Test relative axis
dims: (time:504)
time: 0 days 00:00:00 - 0 days 00:00:56.236909 (504 non-equidistant records)
geometry: GeometryUndefined()
items:
0: Item 1 <Undefined> (undefined)
1: Item 2 <Undefined> (undefined)
2: Item 3 <Undefined> (undefined)
3: Item 4 <Undefined> (undefined)
4: Item 5 <Undefined> (undefined)ds.time[:5]TimedeltaIndex([ '0 days 00:00:00', '0 days 00:00:00.111803',
'0 days 00:00:00.223606', '0 days 00:00:00.335409',
'0 days 00:00:00.447212'],
dtype='timedelta64[ns]', freq=None)df = ds.to_dataframe()
df.head()| Item 1 | Item 2 | Item 3 | Item 4 | Item 5 | |
|---|---|---|---|---|---|
| 0 days 00:00:00 | -0.006862 | -0.000611 | 0.177047 | 32.484425 | -304.720428 |
| 0 days 00:00:00.111803 | -0.011746 | -0.000611 | 0.189257 | 32.292774 | -308.553406 |
| 0 days 00:00:00.223606 | -0.006862 | -0.000611 | 0.189257 | 32.292774 | -308.553406 |
| 0 days 00:00:00.335409 | -0.001978 | 0.004273 | 0.189257 | 32.292774 | -300.887482 |
| 0 days 00:00:00.447212 | 0.002906 | 0.009157 | 0.177047 | 32.292774 | -300.887482 |
df['Item 5'].plot();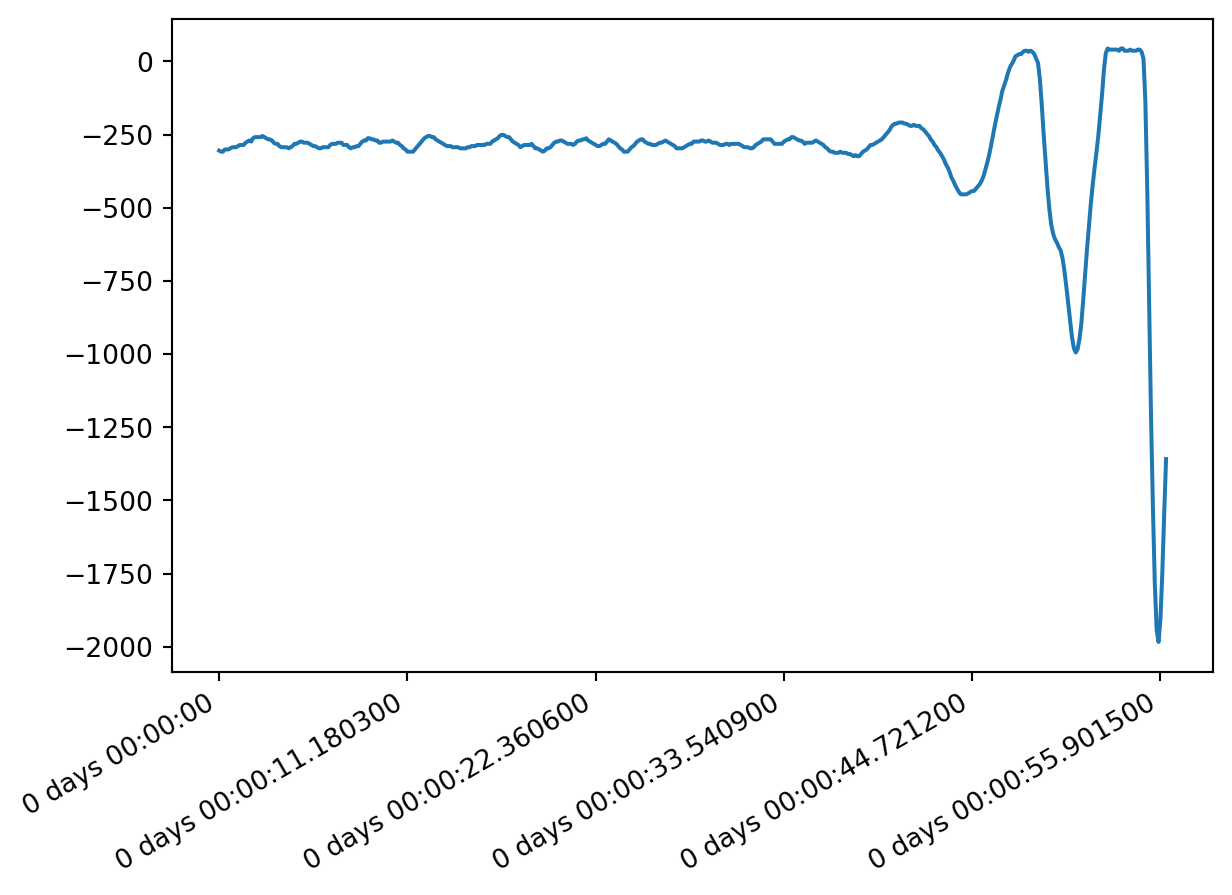
mikecore
An alternative is to use the underlying library mikecore to read the file.
from mikecore.DfsFileFactory import DfsFileFactory

dfs = DfsFileFactory.DfsGenericOpen("../../data/eq_relative.dfs0")
Using the ReadDfs0DataDouble method you get the data as a numpy array, with the time axis or other type of as the first column,
data = dfs.ReadDfs0DataDouble()

type(data)numpy.ndarraywhich can be converted to a pandas dataframe. First we extract the name of items (which in this example hapeens to be not very creative).
index_name = "time"
items = [i.Name for i in dfs.ItemInfo]
items = [index_name] + items
items
['time', 'Item 1', 'Item 2', 'Item 3', 'Item 4', 'Item 5']import pandas as df
df = df.DataFrame(data, columns=items).set_index(index_name)
df.head()| Item 1 | Item 2 | Item 3 | Item 4 | Item 5 | |
|---|---|---|---|---|---|
| time | |||||
| 0.000000 | -0.006862 | -0.000611 | 0.177047 | 32.484425 | -304.720428 |
| 0.111803 | -0.011746 | -0.000611 | 0.189257 | 32.292774 | -308.553406 |
| 0.223606 | -0.006862 | -0.000611 | 0.189257 | 32.292774 | -308.553406 |
| 0.335409 | -0.001978 | 0.004273 | 0.189257 | 32.292774 | -300.887482 |
| 0.447212 | 0.002906 | 0.009157 | 0.177047 | 32.292774 | -300.887482 |