import mikeio

ds = mikeio.read("../data/FakeLake.dfsu")
g = ds.geometry
g.plot()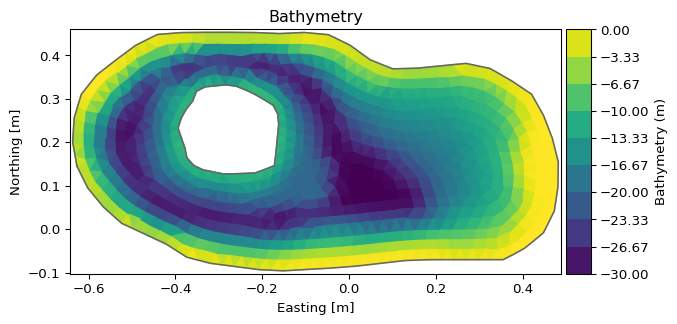
spatial._FM_geometry._GeometryFMPlotter(self, geometry)Plot GeometryFM.
import mikeio
ds = mikeio.read("../data/FakeLake.dfsu")
g = ds.geometry
g.plot()
| Name | Description |
|---|---|
| boundary_nodes | Plot mesh boundary nodes and their code values. |
| contour | Plot bathymetry as contour lines. |
| contourf | Plot bathymetry as filled contours. |
| mesh | Plot mesh only. |
| outline | Plot domain outline. |
spatial._FM_geometry._GeometryFMPlotter.boundary_nodes(
    boundary_names=None,
    figsize=None,
    ax=None,
)
Plot mesh boundary nodes and their code values.
g.plot.boundary_nodes()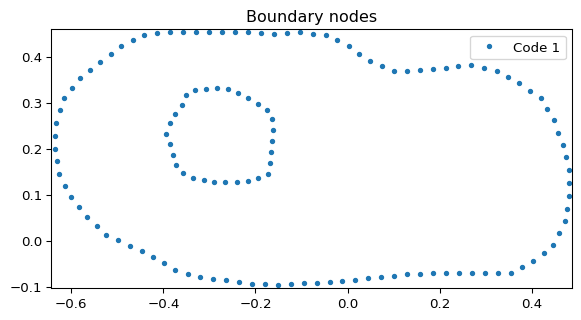
spatial._FM_geometry._GeometryFMPlotter.contour(ax=None, figsize=None, **kwargs)Plot bathymetry as contour lines.
g.plot.contour()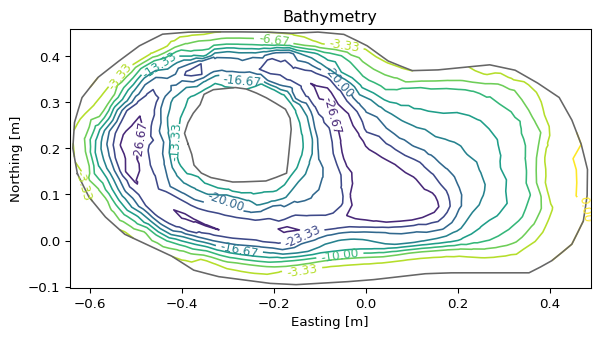
spatial._FM_geometry._GeometryFMPlotter.contourf(
    ax=None,
    figsize=None,
    **kwargs,
)
Plot bathymetry as filled contours.
g.plot.contourf()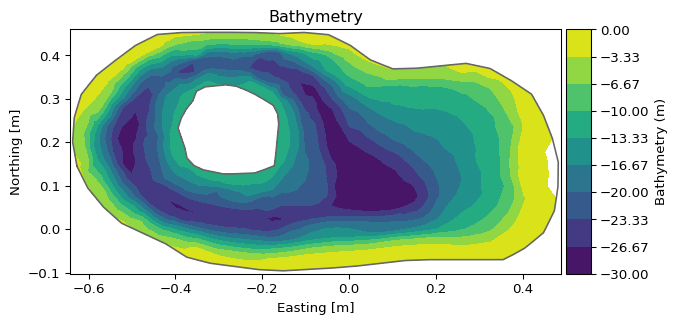
spatial._FM_geometry._GeometryFMPlotter.mesh(
    title='Mesh',
    figsize=None,
    ax=None,
)
Plot mesh only.
g.plot.mesh()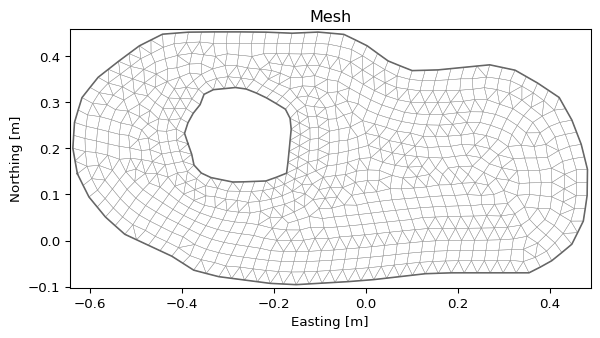
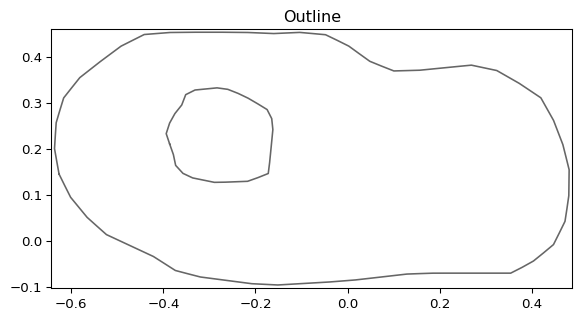
spatial._FM_geometry._GeometryFMPlotter.outline(
    title='Outline',
    figsize=None,
    ax=None,
)
Plot domain outline.
g.plot.outline()