import mikeio
ds = mikeio.read("../data/oresund_sigma_z.dfsu")
ds.plot.scatter(x="Salinity", y="Temperature", title="S-vs-T")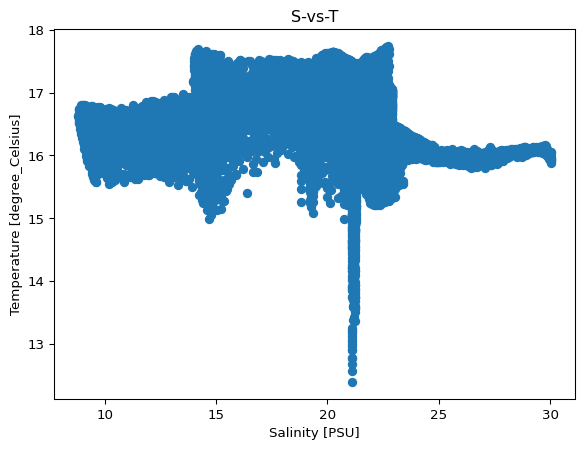
dataset._DatasetPlotter(self, ds)Class for plotting scatter plots from datasets.
| Name | Description |
|---|---|
| scatter | Plot data from two DataArrays against each other in a scatter plot. |
dataset._DatasetPlotter.scatter(
    x,
    y,
    ax=None,
    figsize=None,
    title=None,
    **kwargs,
)
Plot data from two DataArrays against each other in a scatter plot.
| Name | Type | Description | Default |
|---|---|---|---|
| x | str or int | Identifier for first DataArray | required |
| y | str or int | Identifier for second DataArray | required |
| ax | Axes | None | Adding to existing axis, instead of creating new fig | None |
| figsize | tuple[float, float] | None | specify size of figure | None |
| title | str | None | axes title | None |
| **kwargs | Any | additional kwargs will be passed to ax.scatter() | {} |
| Name | Type | Description |
|---|---|---|
| <matplotlib.axes> |
import mikeio
ds = mikeio.read("../data/oresund_sigma_z.dfsu")
ds.plot.scatter(x="Salinity", y="Temperature", title="S-vs-T")
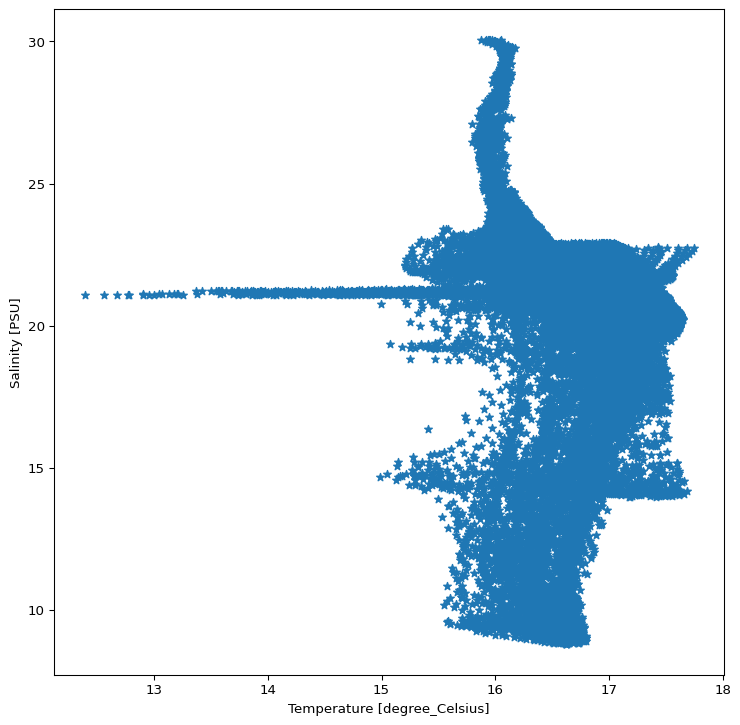
ds.plot.scatter(x=0, y=1, figsize=(9,9), marker='*')