import mikeio
ds = mikeio.read("../data/oresund_sigma_z.dfsu")
dsp = ds.sel(x=333934.1, y=6158101.5)
da = dsp["Temperature"]
da.plot()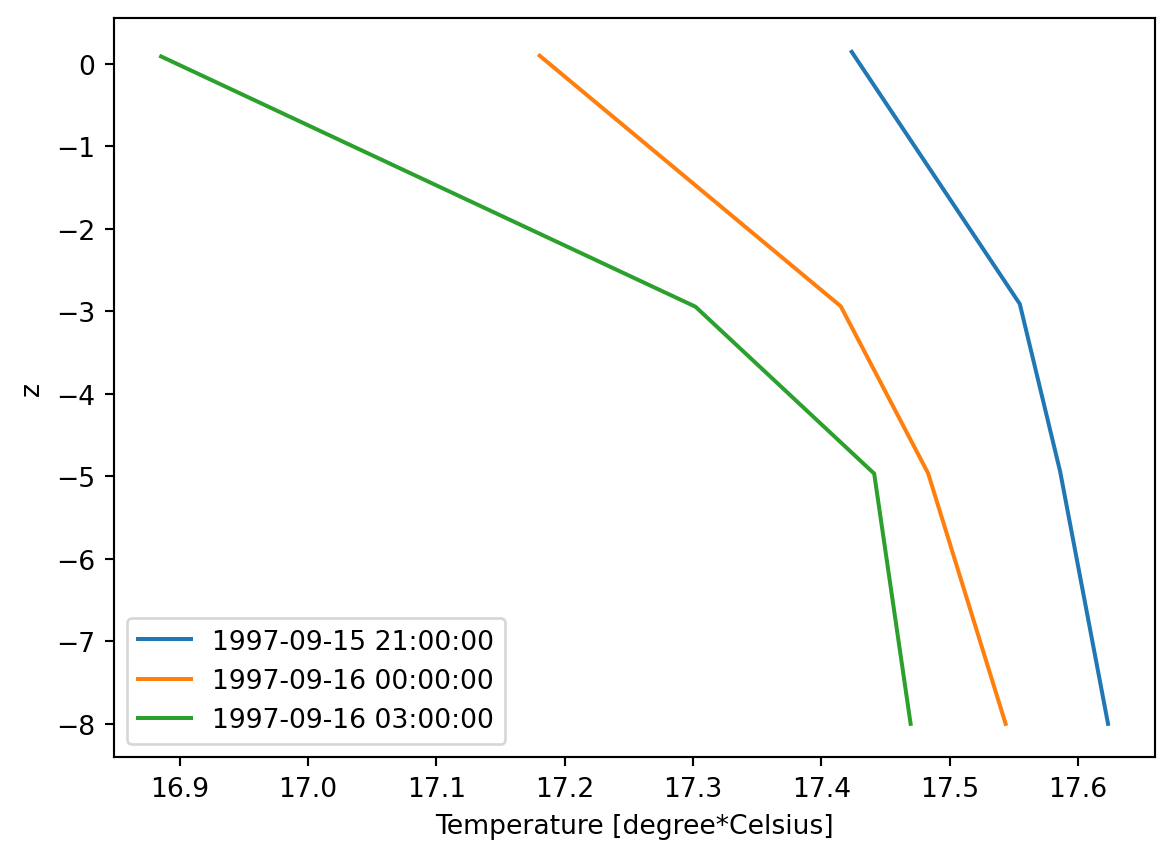
dataset._DataArrayPlotterFMVerticalColumn(self, da)Plot a DataArray with a GeometryFMVerticalColumn geometry.
import mikeio
ds = mikeio.read("../data/oresund_sigma_z.dfsu")
dsp = ds.sel(x=333934.1, y=6158101.5)
da = dsp["Temperature"]
da.plot()
da.plot(extrapolate=False, marker='o')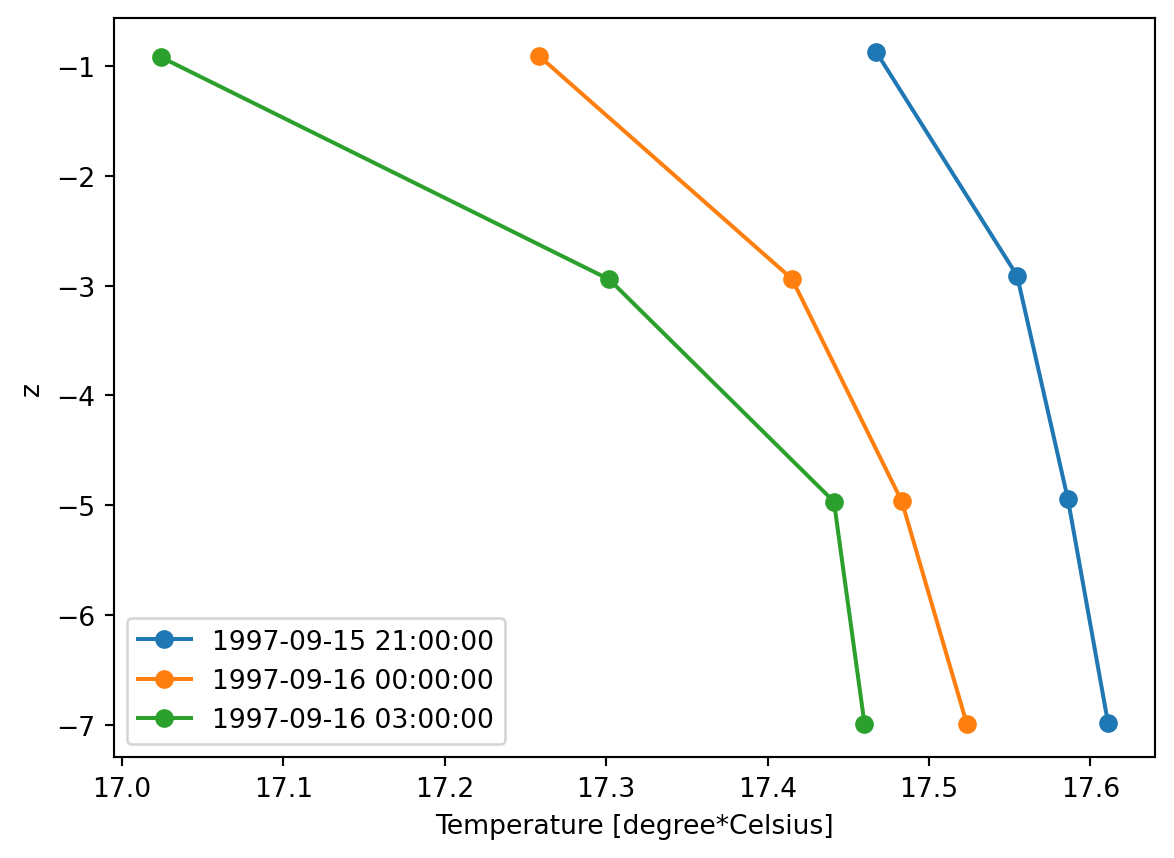
da.plot.pcolormesh()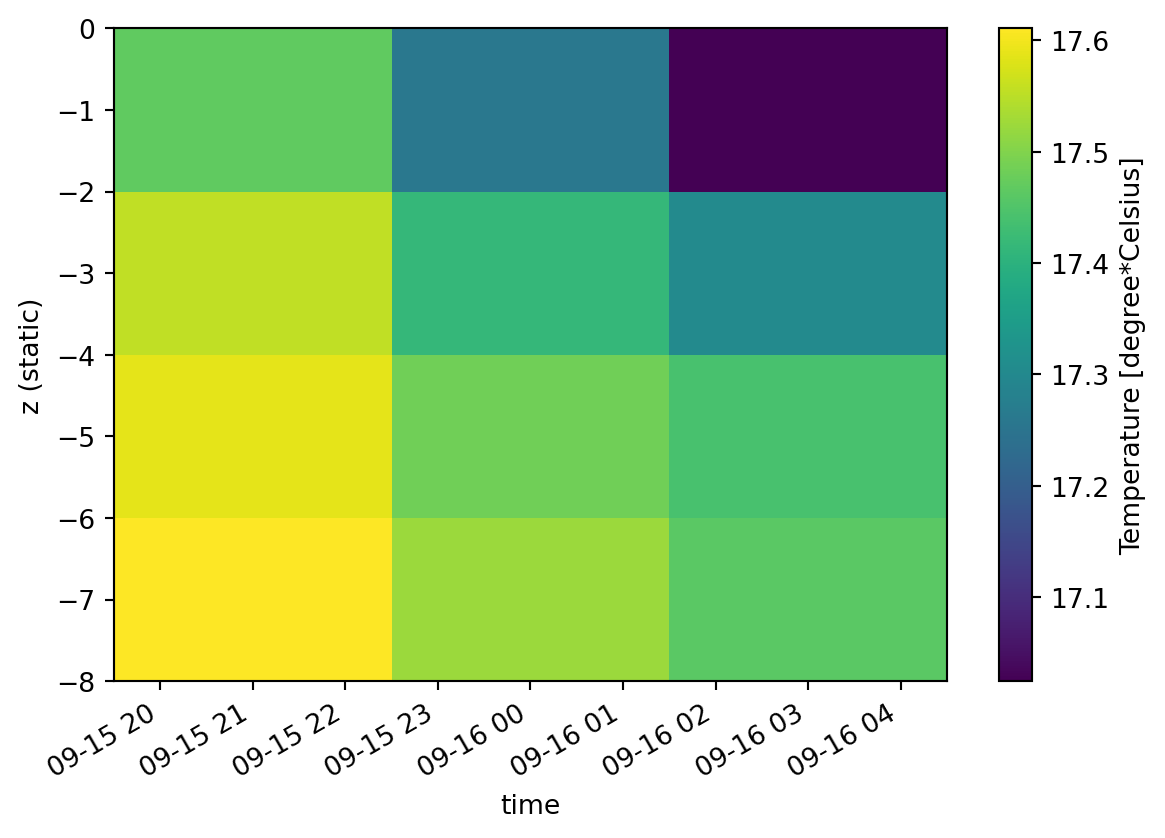
| Name | Description |
|---|---|
| hist | Plot DataArray as histogram (using ax.hist). |
| line | Plot data as vertical lines. |
| pcolormesh | Plot data as coloured patches. |
dataset._DataArrayPlotterFMVerticalColumn.hist(
    bins=None,
    ax=None,
    figsize=None,
    title=None,
    **kwargs,
)
Plot DataArray as histogram (using ax.hist).
| Name | Type | Description | Default |
|---|---|---|---|
| bins | (int or sequence or str) | If bins is an integer, it defines the number of equal-width bins in the range. If bins is a sequence, it defines the bin edges, including the left edge of the first bin and the right edge of the last bin. by default: rcParams[“hist.bins”] (default: 10) | None |
| ax | Axes | None | Adding to existing axis, instead of creating new fig | None |
| figsize | tuple[float, float] | None | specify size of figure | None |
| title | str | None | axes title | None |
| **kwargs | Any | additional arguments passed to the plotting function | {} |
matplotlib.pyplot.hist
| Name | Type | Description |
|---|---|---|
| <matplotlib.axes> |
dataset._DataArrayPlotterFMVerticalColumn.line(
    ax=None,
    figsize=None,
    extrapolate=True,
    **kwargs,
)
Plot data as vertical lines.
dataset._DataArrayPlotterFMVerticalColumn.pcolormesh(
    ax=None,
    figsize=None,
    title=None,
    **kwargs,
)
Plot data as coloured patches.