import pandas as pd
import numpy as np
import matplotlib.pyplot as plt
from tsod import (
    CombinedDetector,
    RangeDetector,
    DiffDetector,
    RollingStandardDeviationDetector,
    HampelDetector
)Example Water Level
Clean a real water level time series using a combined detector.
Clean water level data
df = pd.read_csv("../../tests/data/Ballen_20150218-20201222.csv", index_col=0, parse_dates=True)
data = df.water_level
ax = data.plot(figsize=(16, 4), title="Water Level Data")
ax.grid(True)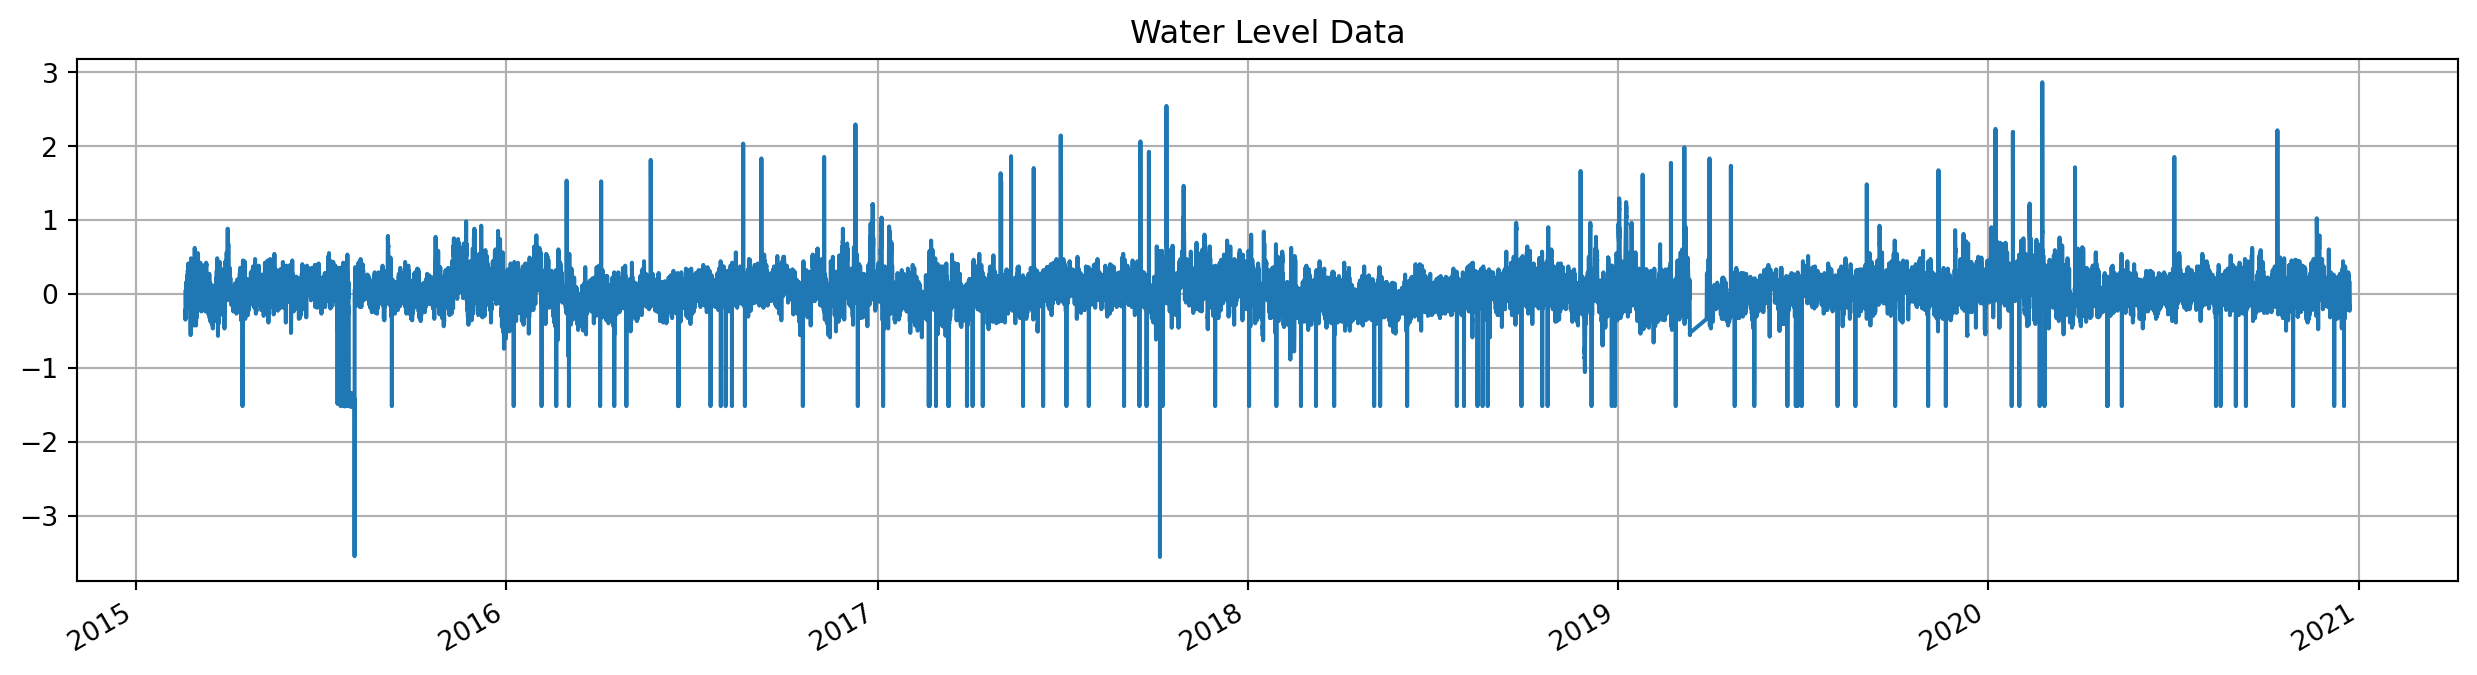
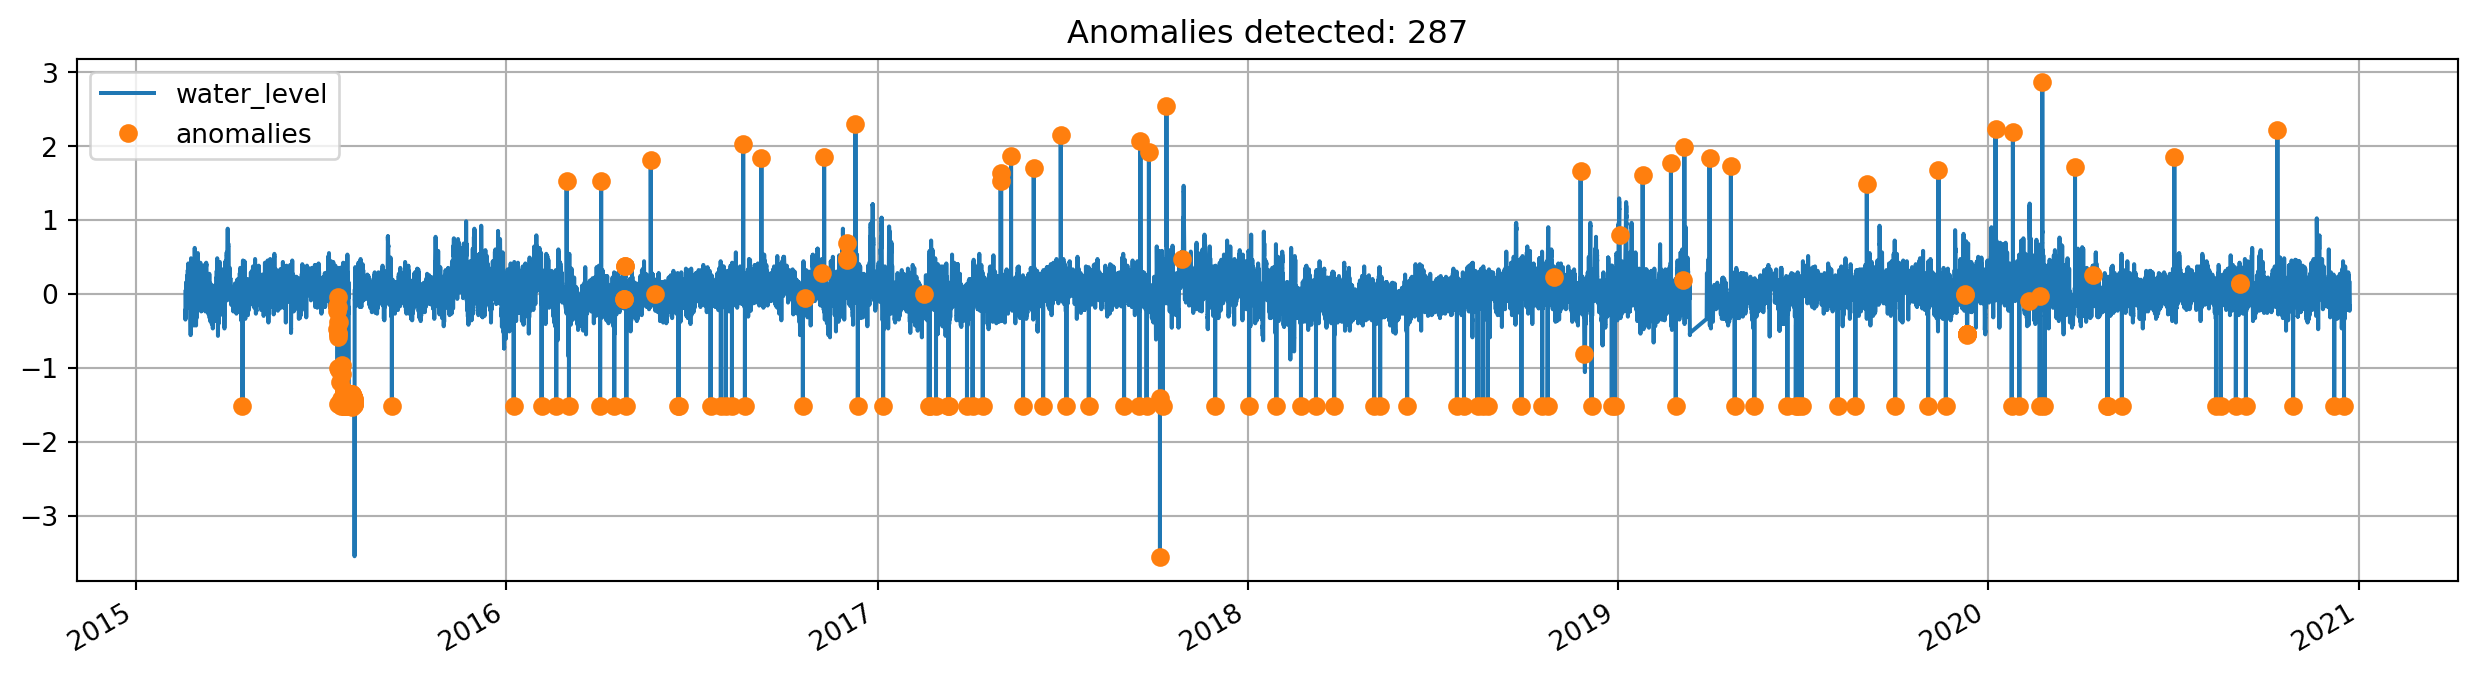
Detect anomalies outside manually set range
range_anomalies = RangeDetector(-1, 1.3).detect(data)detected = data.to_frame()
detected["anomalies"] = data[range_anomalies]
ax = detected.plot(
style=["-", "o"],
figsize=(16, 4),
title=f"Anomalies detected: {range_anomalies.sum()}",
grid=True,
)
# Set anomalies as NaN for further processing
data_clean = data.copy()
data_clean[range_anomalies] = np.nan
Detect anomalies outside automatically set range
# Prepare example data: split into train and test
N = 5000
normal_data, test_data = data[:N], data[N:]
ax = normal_data.plot(figsize=(16, 4), grid=True, legend=True, label="Train Data")
ax = test_data.plot(ax=ax, grid=True, legend=True, label="Test Data", title="Train and Test Data")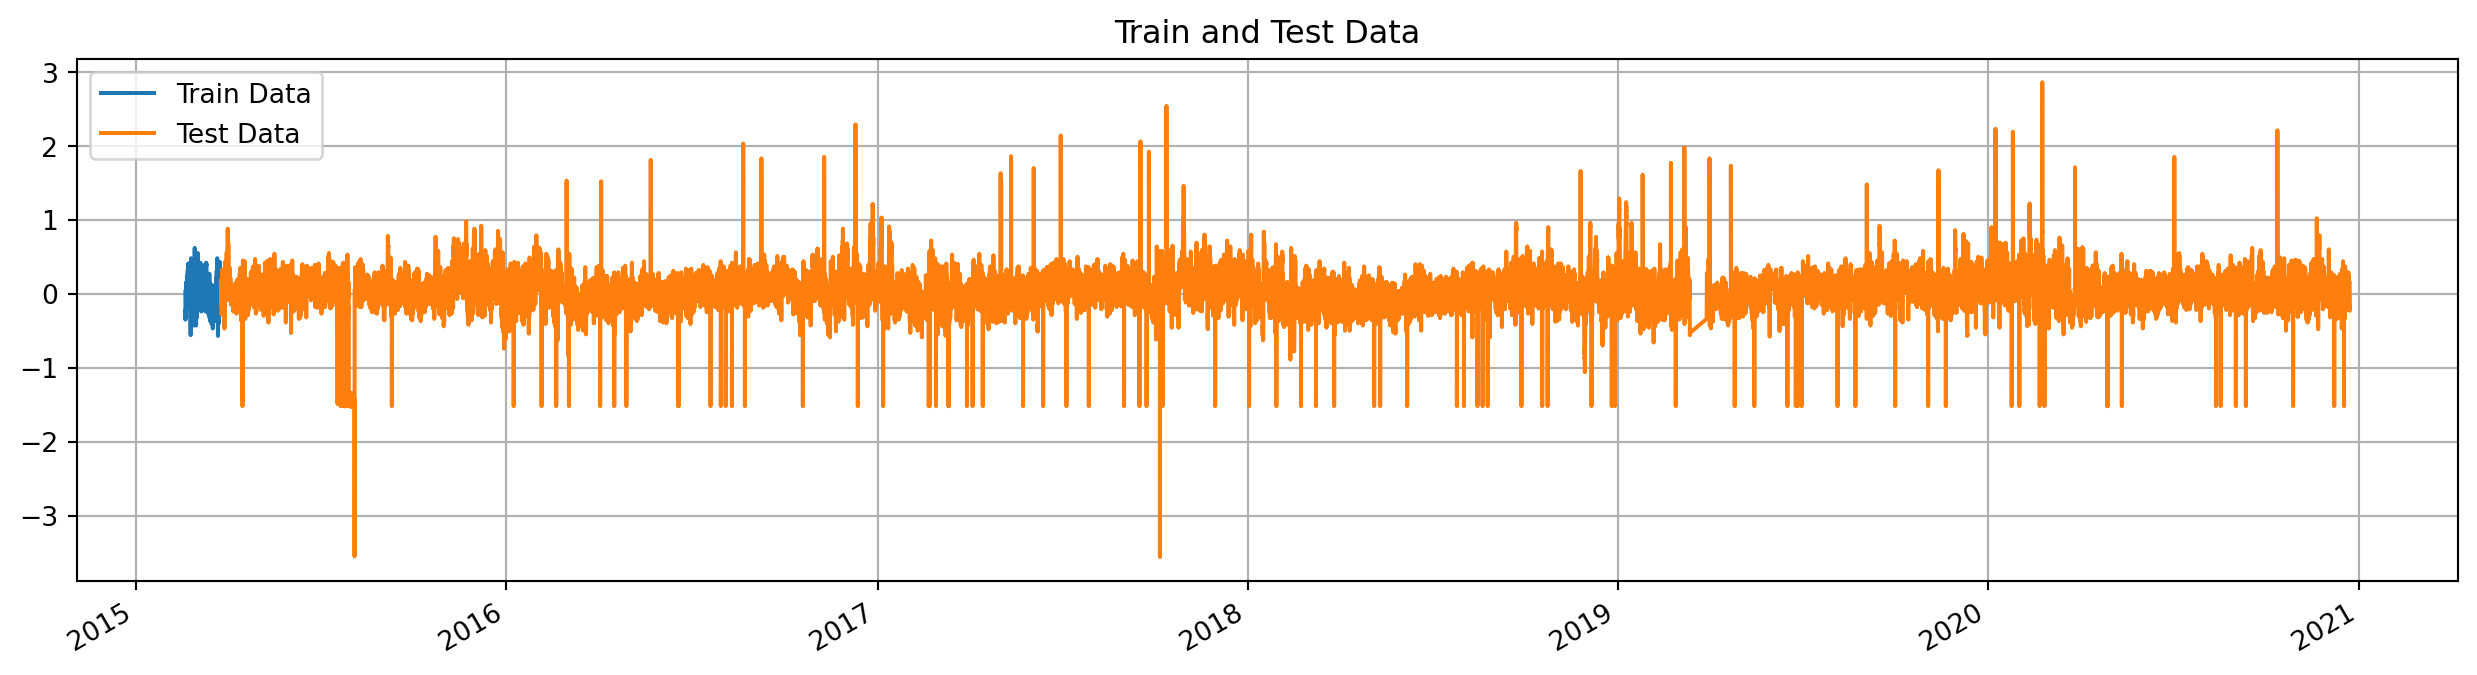
anomaly_detector = CombinedDetector([RangeDetector(), DiffDetector()])
anomaly_detector.fit(normal_data)
detected_anomalies = anomaly_detector.detect(test_data)
fig, ax = plt.subplots(2,1, figsize=(16, 8))
test_data.plot(ax=ax[0], title="Data and anomalies", grid=True)
ax[0] = test_data[detected_anomalies].plot(ax=ax[0], style="ro", markersize=3, grid=True)
test_data[~detected_anomalies].plot(ax=ax[1], title="Cleaned Data", grid=True)
plt.tight_layout()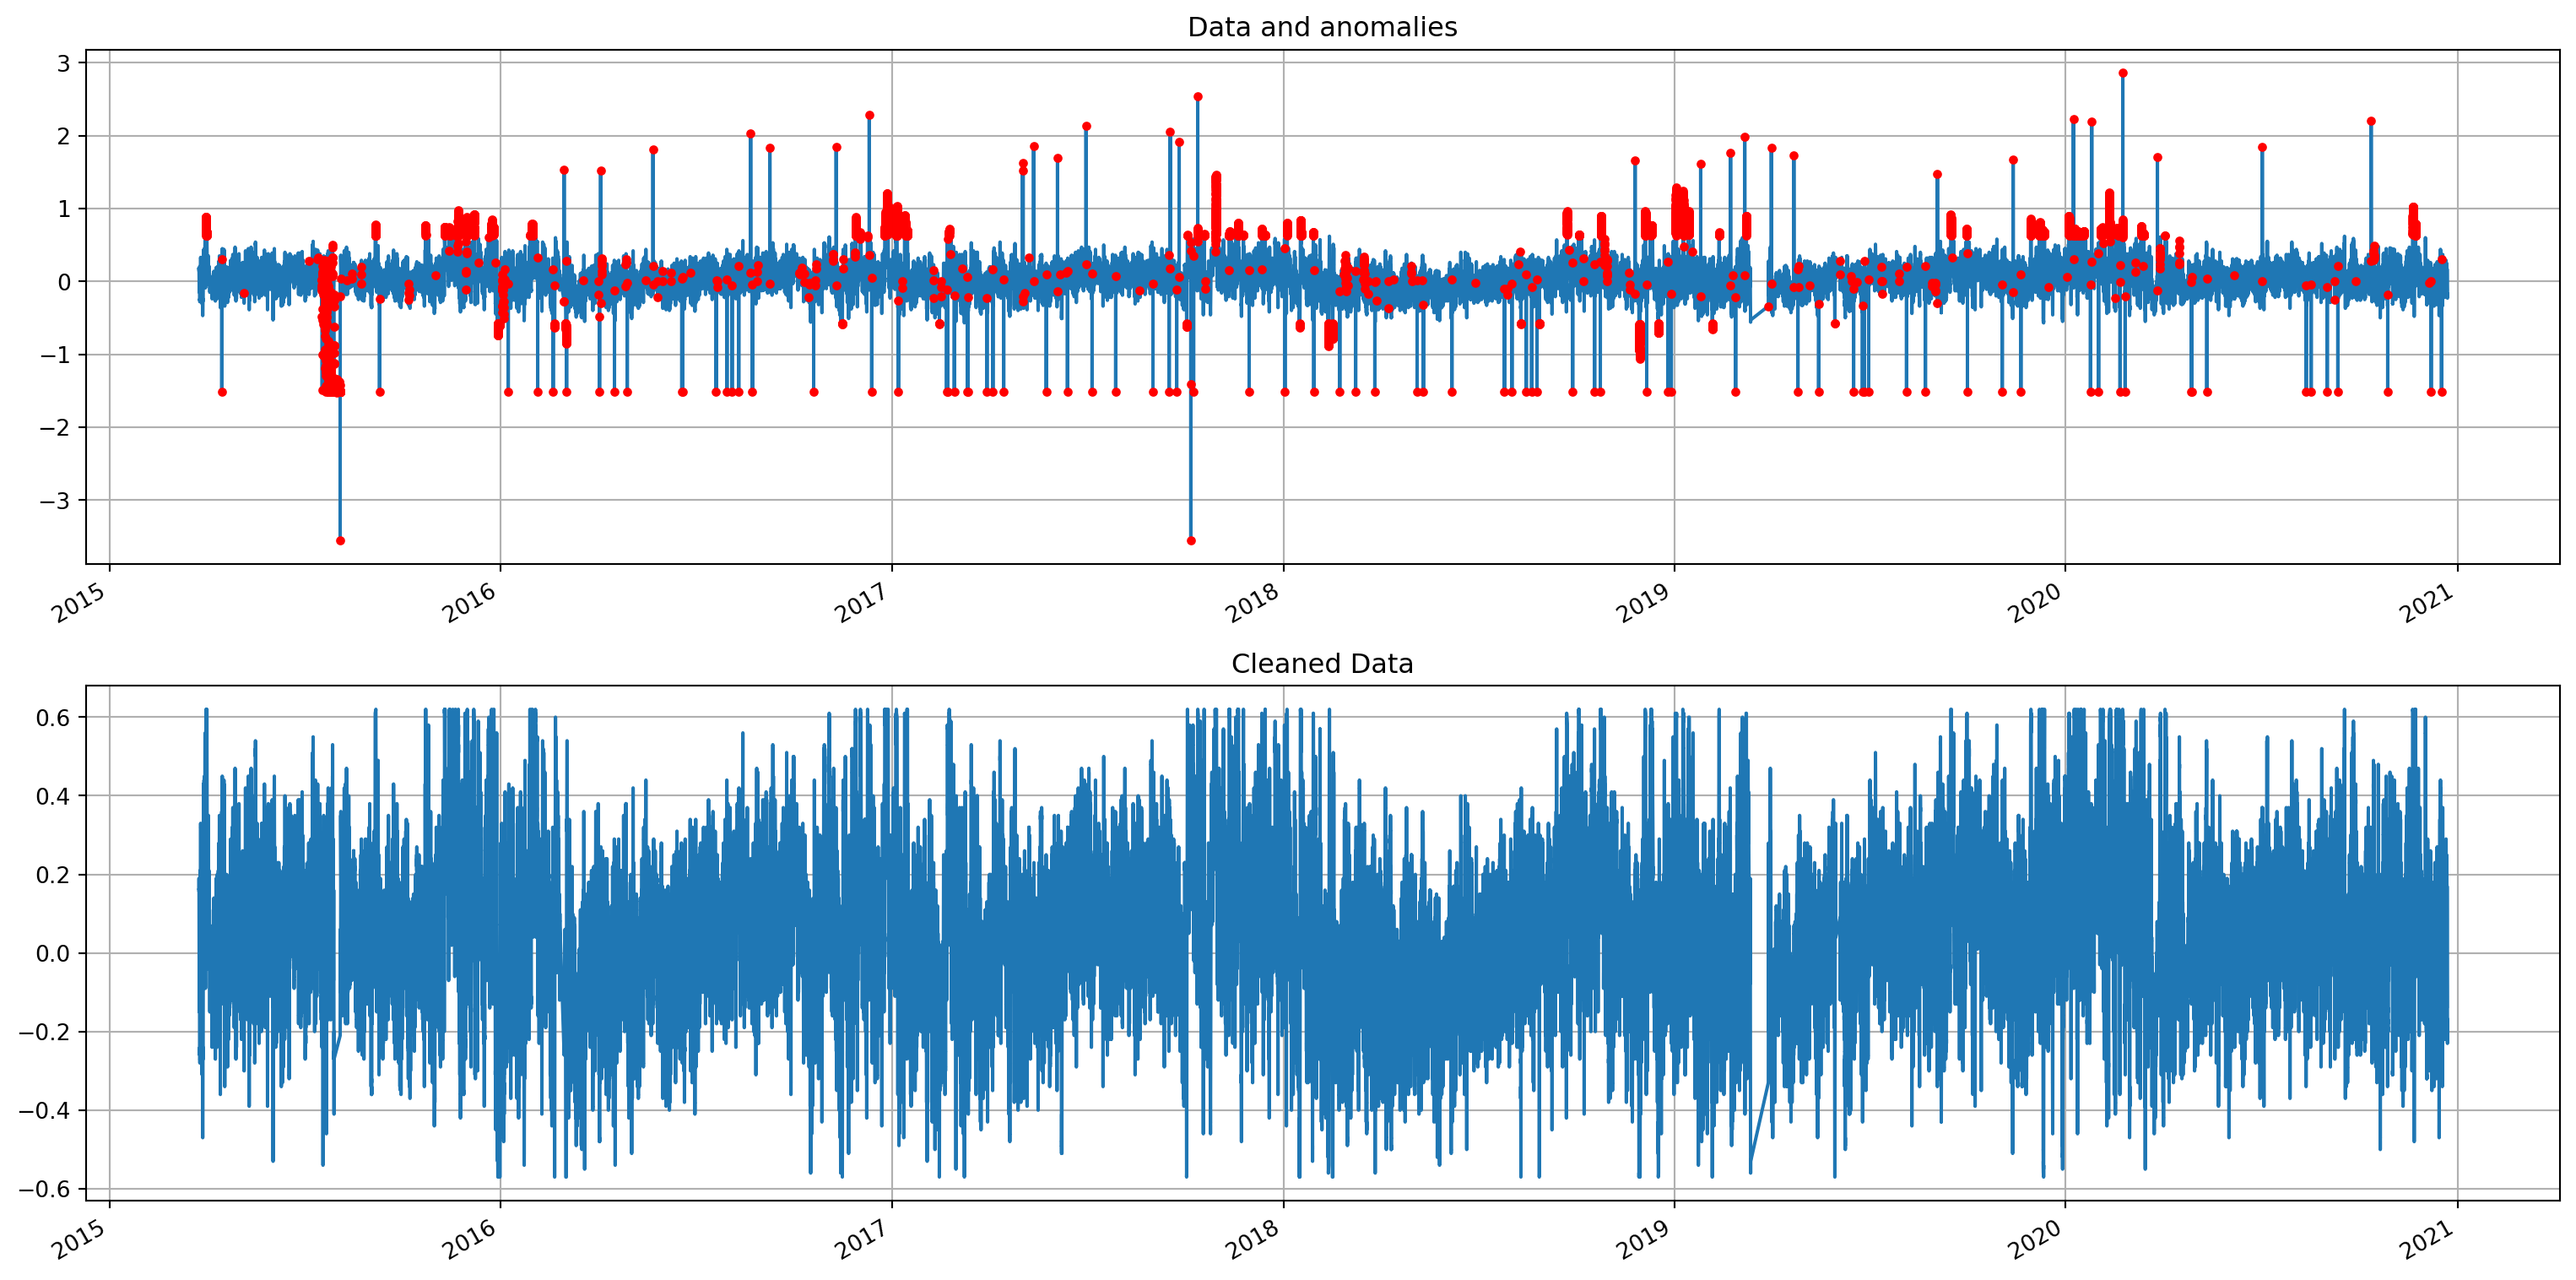
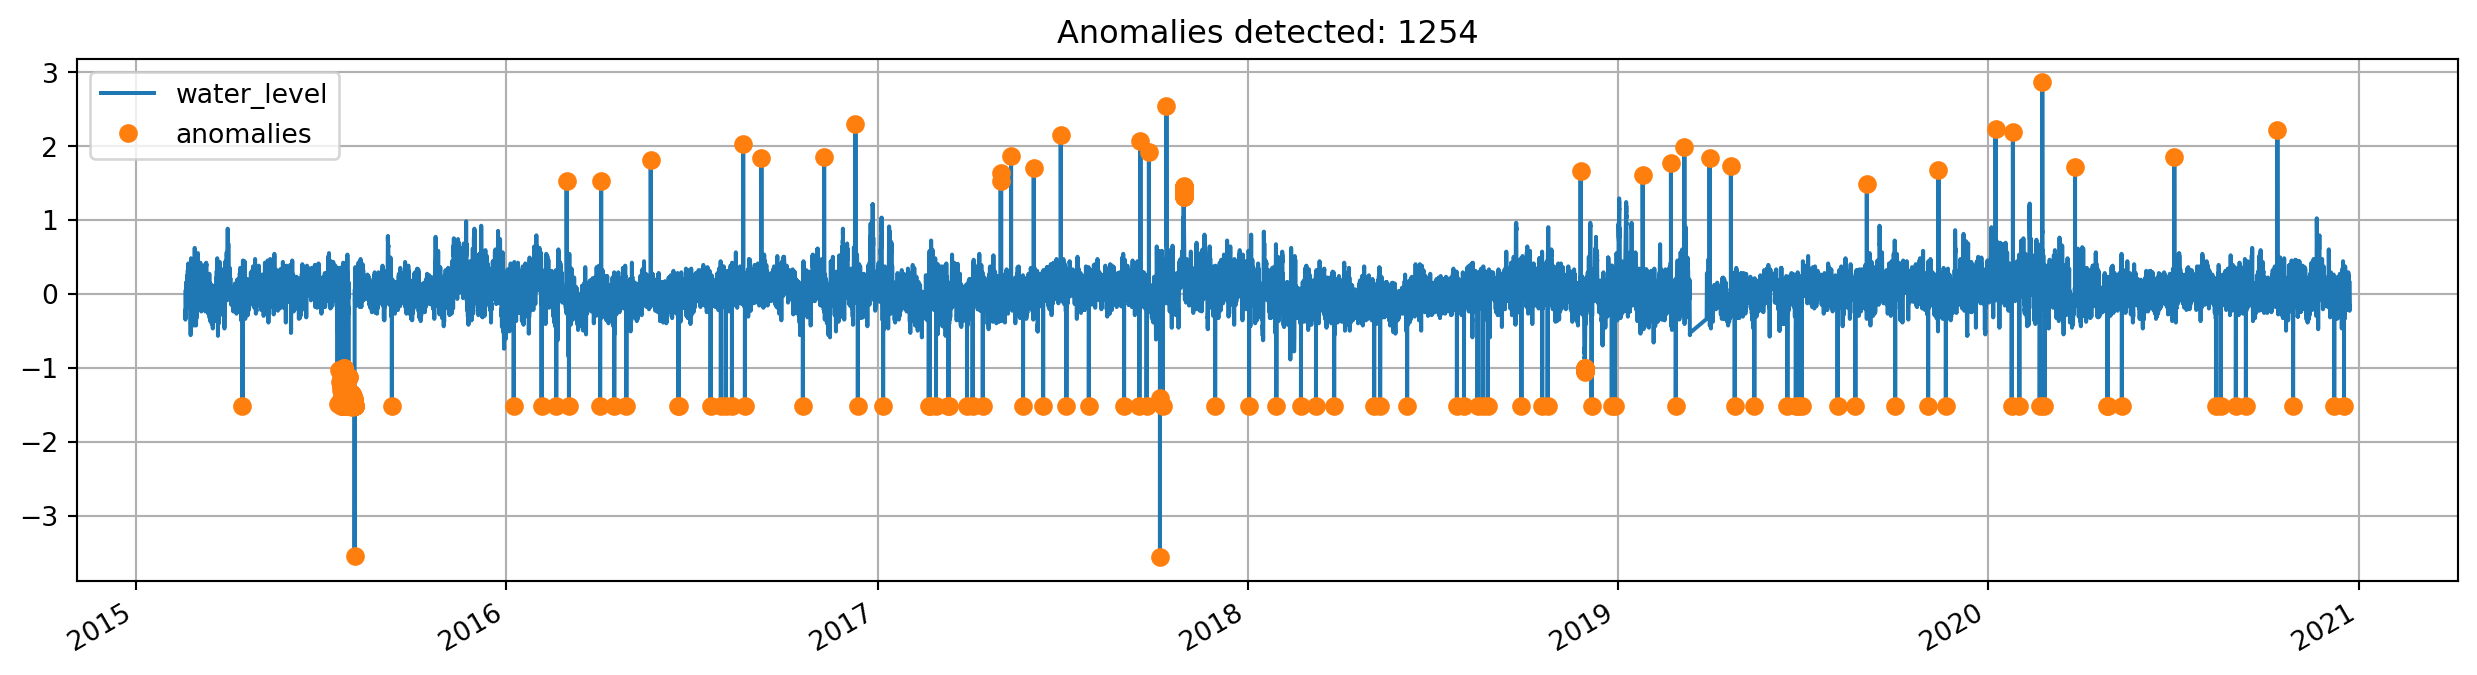
Detect drops and peaks
detector = RollingStandardDeviationDetector(10, 0.1)
std_anomalies = detector.detect(data)
detected = data.to_frame()
detected["anomalies"] = data[std_anomalies]
ax = detected.plot(style=["-", "o"], figsize=(16, 4), grid=True, title=f"Anomalies detected: {std_anomalies.sum()}")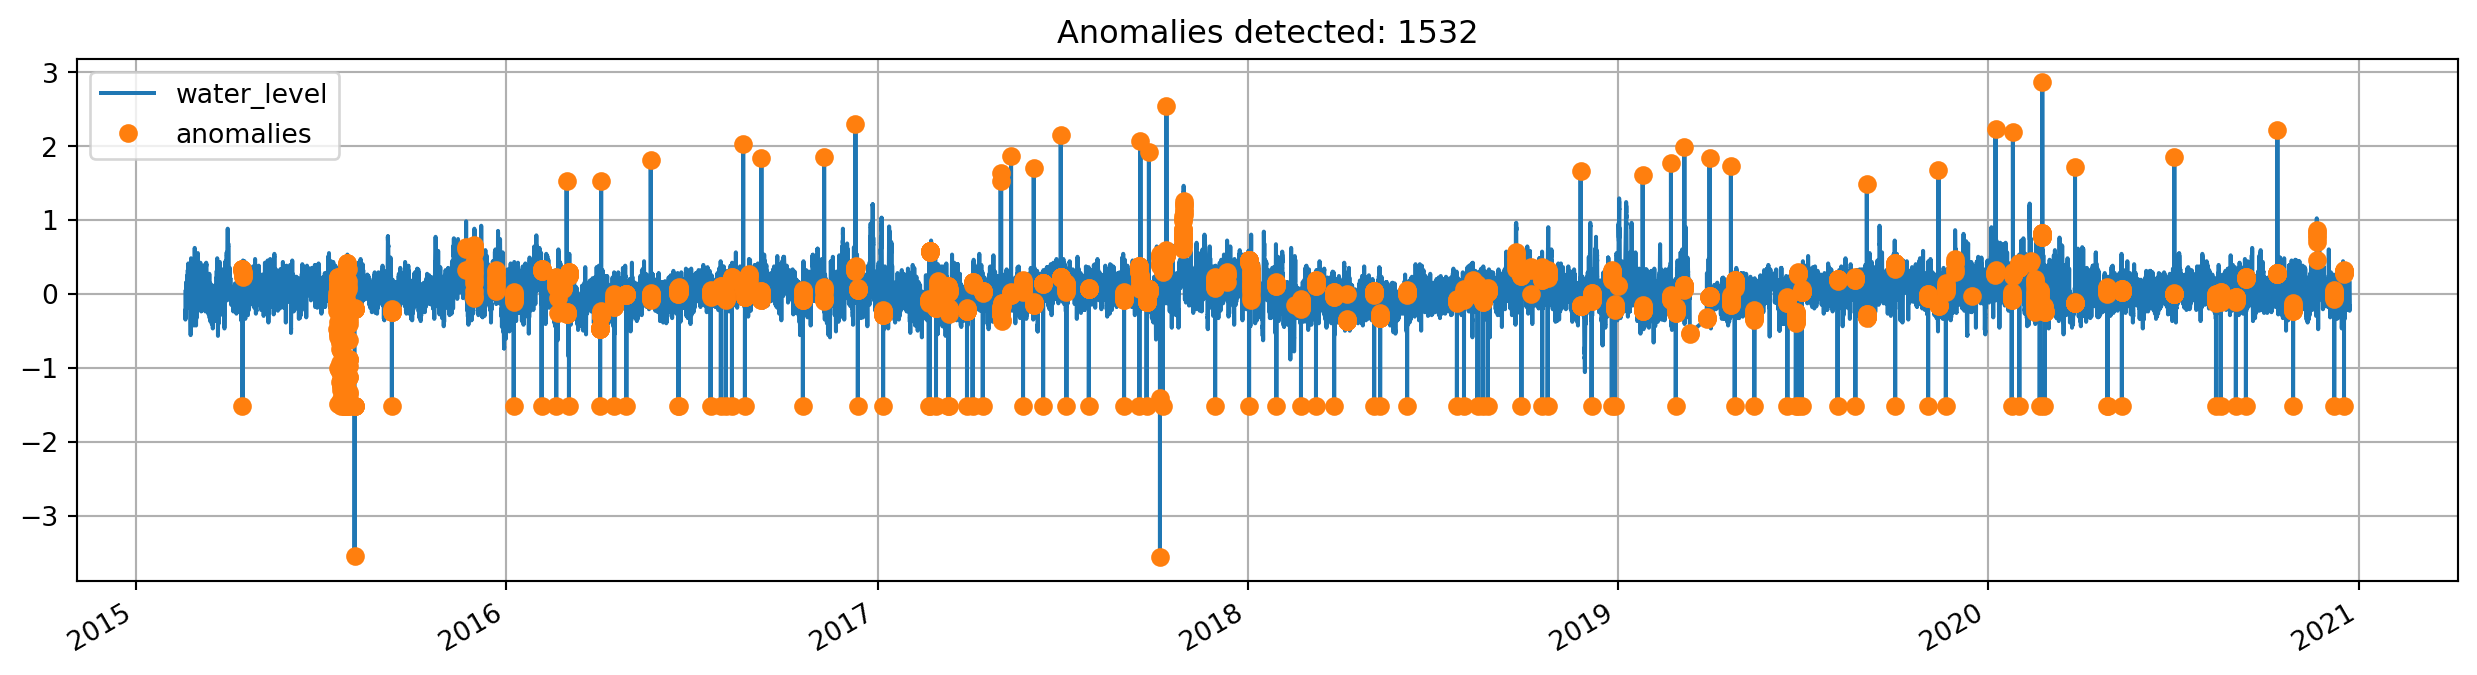
Hampel filter
Filter for detecting outliers
The default threshold of the HampelDetector is 3, which means that a sample that deviates by more than three times of the rolling window’s standard deviation is marked as an anomaly. Increasing the threshold marks more samples as anomalies, decreasing the threshold marks fewer.
detector = HampelDetector(window_size=20, threshold=3)anomalies = detector.detect(data)detected = data.to_frame()
detected["anomalies"] = data[anomalies]
ax = detected.plot(
style=["-", "o"], figsize=(16, 4), grid=True, title=f"Anomalies detected: {sum(anomalies)}"
)