import mikeioDfs2 - Various types
This notebook examines various Dfs2 types:
- Horizontal
- UTM (utm_not_rotated_neurope_temp.dfs2)
- Long/Lat (europe_wind_long_lat.dfs2)
- Long/Lat global (global_long_lat_pacific_view_temperature_delta.dfs2)
- Local coordinates (M3WFM_sponge_local_coordinates.dfs2)
- Rotated
- UTM (BW_Ronne_Layout1998_rotated.dfs2)
- UTM (BW_Ronne_Layout1998_rotated.dfs2)
- Vertical (hd_vertical_slice.dfs2)
- Spectral
- Linear f-axis (dir_wave_analysis_spectra.dfs2)
- Logarithmic f-axis (pt_spectra.dfs2)
For each of these types, it’s possible to :
- plot
- isel
- sel (point, line or area)
- read and write without changing header (origo and rotation)
Horizontal
Horizontal, UTM (projected)
fn = "../tests/testdata/utm_not_rotated_neurope_temp.dfs2"
dfs = mikeio.open(fn)
da = dfs.read()[0]
da
<mikeio.DataArray>
name: Temperature
dims: (time:2, y:104, x:119)
time: 2022-03-01 00:00:00 - 2022-03-01 12:00:00 (2 records)
geometry: Grid2D (ny=104, nx=119)da.geometry<mikeio.Grid2D>
x: [-2.778e+05, -2.611e+05, ..., 1.689e+06] (nx=119, dx=1.667e+04)
y: [5.667e+06, 5.684e+06, ..., 7.384e+06] (ny=104, dy=1.667e+04)
projection: UTM-32da.plot();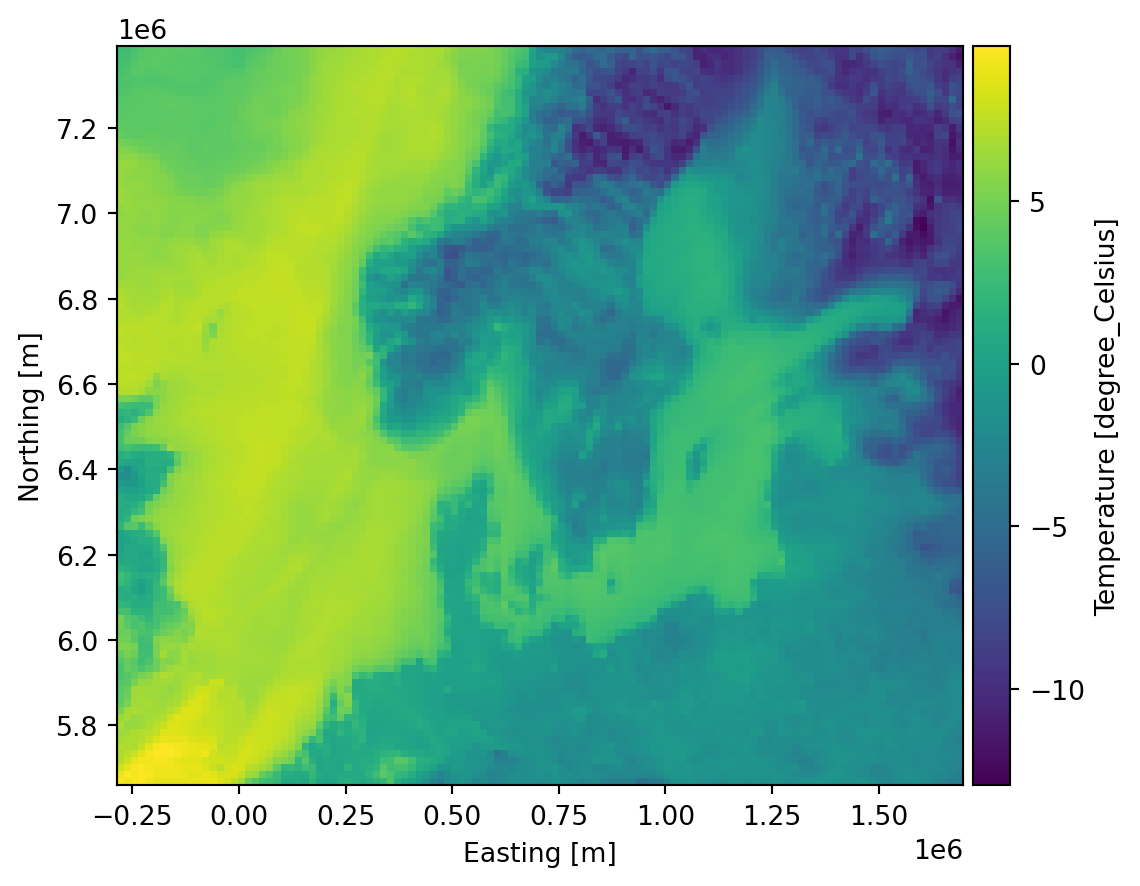
Horizontal, geographic (long/lat)
fn = "../tests/testdata/europe_wind_long_lat.dfs2"
da = mikeio.read(fn)[1]
da
<mikeio.DataArray>
name: Wind x-comp (10m)
dims: (time:1, y:101, x:221)
time: 2012-01-01 00:00:00 (time-invariant)
geometry: Grid2D (ny=101, nx=221)da.geometry<mikeio.Grid2D>
x: [-15, -14.75, ..., 40] (nx=221, dx=0.25)
y: [30, 30.25, ..., 55] (ny=101, dy=0.25)
projection: LONG/LATda.plot();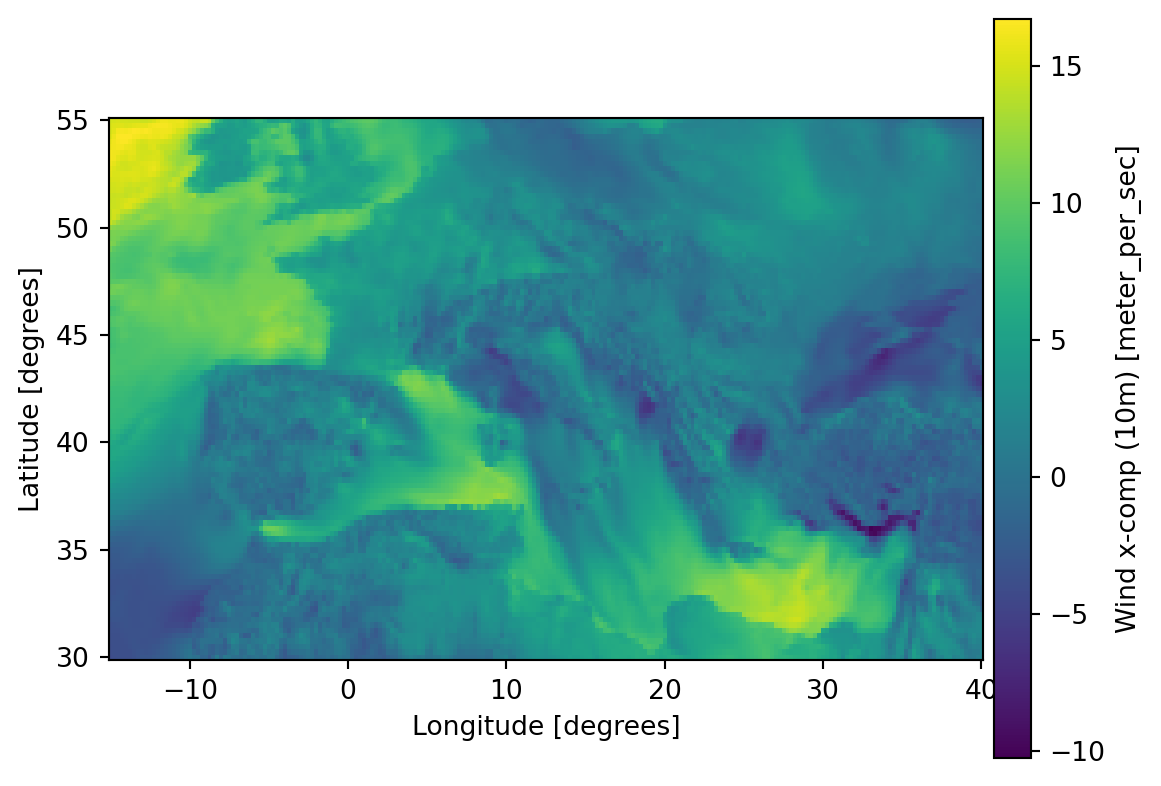
Horizontal, geographic with global coverage
fn = "../tests/testdata/global_long_lat_pacific_view_temperature_delta.dfs2"
da = mikeio.read(fn)[0]
da
<mikeio.DataArray>
name: air_temperature_anomaly
dims: (time:12, y:73, x:96)
time: 2089-01-16 00:00:00 - 2089-12-16 00:00:00 (12 non-equidistant records)
geometry: Grid2D (ny=73, nx=96)da.geometry<mikeio.Grid2D>
x: [0, 3.75, ..., 356.2] (nx=96, dx=3.75)
y: [-90, -87.5, ..., 90] (ny=73, dy=2.5)
projection: LONG/LATda.plot();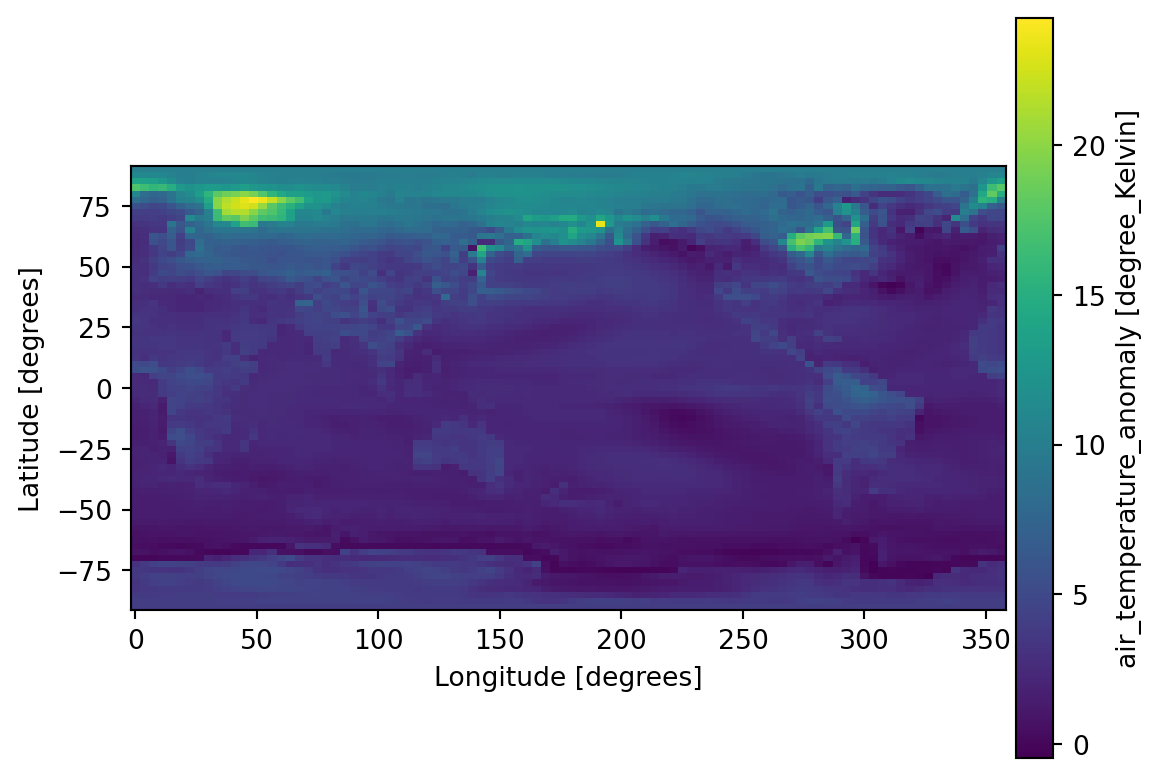
da.sel(area=[110,-50,160,-10]).plot();
Local coordinates
fn = "../tests/testdata/M3WFM_sponge_local_coordinates.dfs2"
da = mikeio.read(fn)[0]
da
<mikeio.DataArray>
name: z (m)
dims: (time:1, y:62, x:362)
time: 1990-01-01 12:00:00 (time-invariant)
geometry: Grid2D (ny=62, nx=362)da.plot();
da.sel(y=3).plot();
Rotated
fn = "../tests/testdata/BW_Ronne_Layout1998_rotated.dfs2"
da = mikeio.read(fn)[0]
da
<mikeio.DataArray>
name: Bathymetry
dims: (time:1, y:172, x:263)
time: 1990-01-01 12:00:00 (time-invariant)
geometry: Grid2D (ny=172, nx=263)da.geometry<mikeio.Grid2D>
x: [0, 5, ..., 1310] (nx=263, dx=5)
y: [0, 5, ..., 855] (ny=172, dy=5)
origin: (4.797e+05, 6.105e+06), orientation: -22.239
projection: PROJCS["UTM-33",GEOGCS["Unused",DATUM["UTM Projections",SPHEROID["WGS 1984",6378137,298.257223563]],PRIMEM["Greenwich",0],UNIT["Degree",0.0174532925199433]],PROJECTION["Transverse_Mercator"],PARAMETER["False_Easting",500000],PARAMETER["False_Northing",0],PARAMETER["Central_Meridian",15],PARAMETER["Scale_Factor",0.9996],PARAMETER["Latitude_Of_Origin",0],UNIT["Meter",1]]da.plot();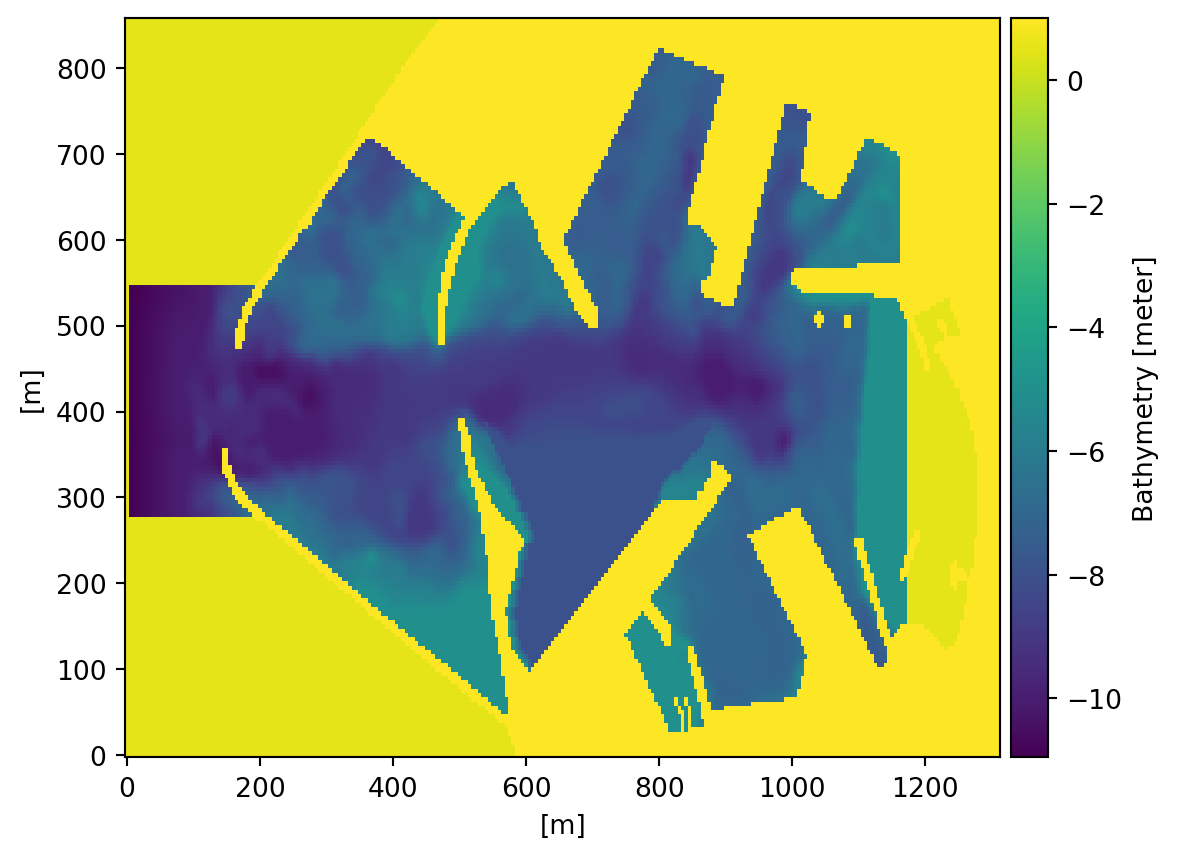
Vertical
fn = "../tests/testdata/hd_vertical_slice.dfs2"
da = mikeio.read(fn)[0]
da
<mikeio.DataArray>
name: U velocity
dims: (time:13, y:76, x:41)
time: 2022-04-23 00:00:00 - 2022-04-23 12:00:00 (13 records)
geometry: Grid2D (ny=76, nx=41)da.geometry<mikeio.Grid2D>
x: [0, 0.0193, ..., 0.7722] (nx=41, dx=0.0193)
y: [0, 1, ..., 75] (ny=76, dy=1)
projection: NON-UTMda.plot();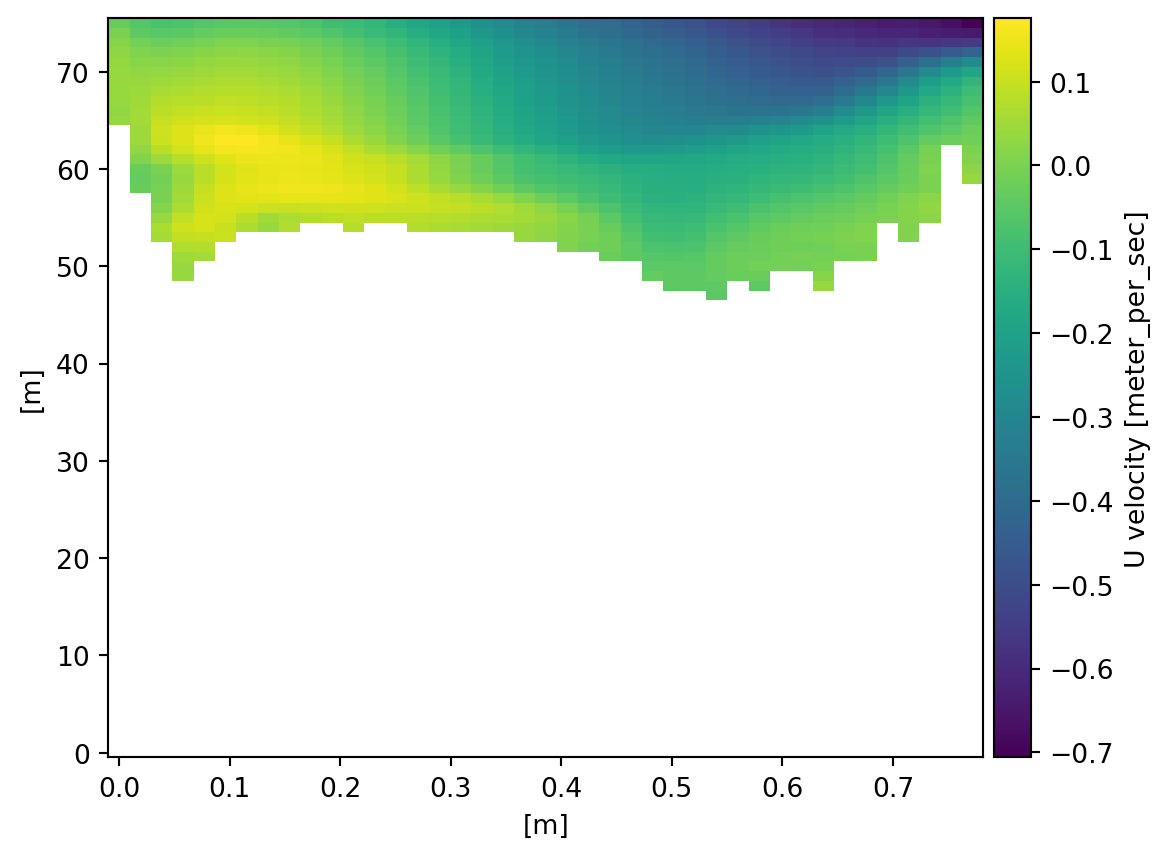
da.isel(y=slice(45,None)).plot();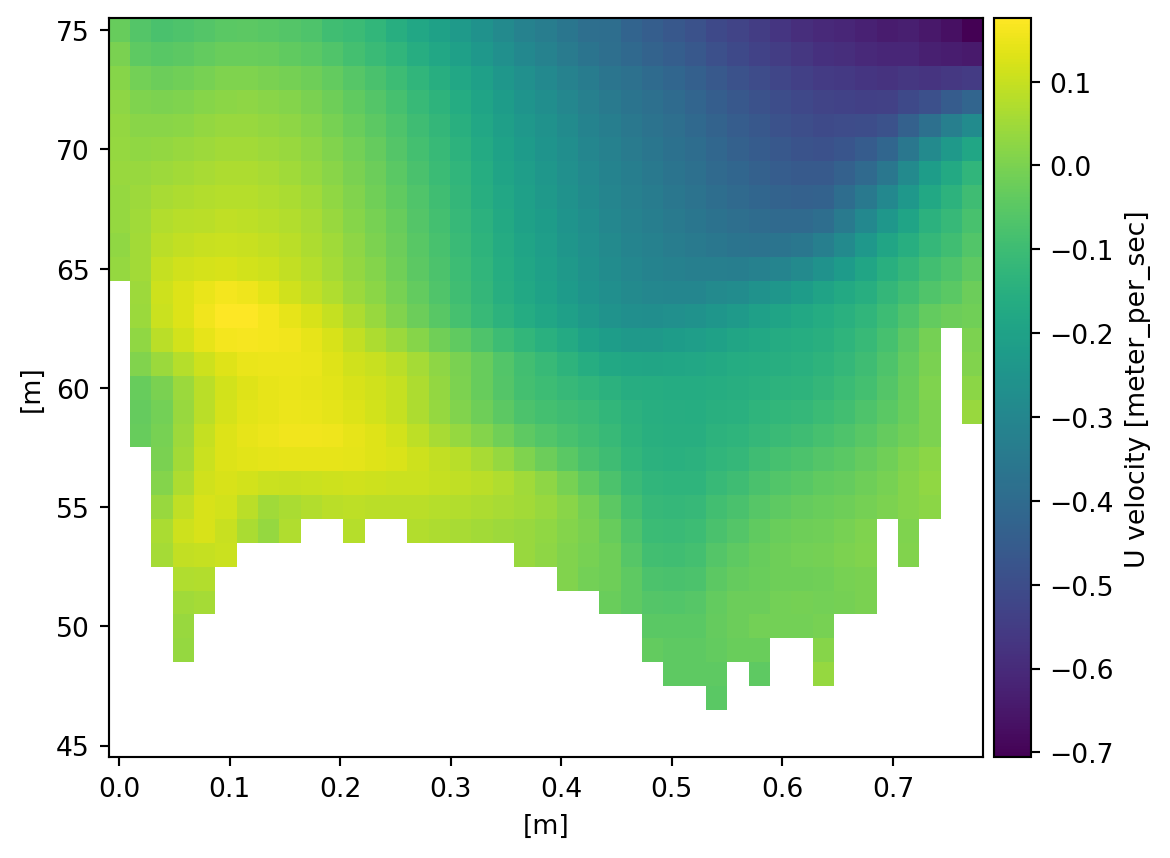
Spectral
Linear f-axis
fn = "../tests/testdata/dir_wave_analysis_spectra.dfs2"
dfs = mikeio.open(fn) #, type="spectral")
da = dfs.read()[0]
da
<mikeio.DataArray>
name: Directional spectrum [1]
dims: (time:1, y:37, x:128)
time: 1970-01-01 00:00:00 (time-invariant)
geometry: Grid2D (ny=37, nx=128)da.geometry<mikeio.Grid2D>
x: [0.003906, 0.007812, ..., 0.5] (nx=128, dx=0.003906)
y: [0, 10, ..., 360] (ny=37, dy=10)
projection: NON-UTMda.geometry.is_spectral = True
da.plot();
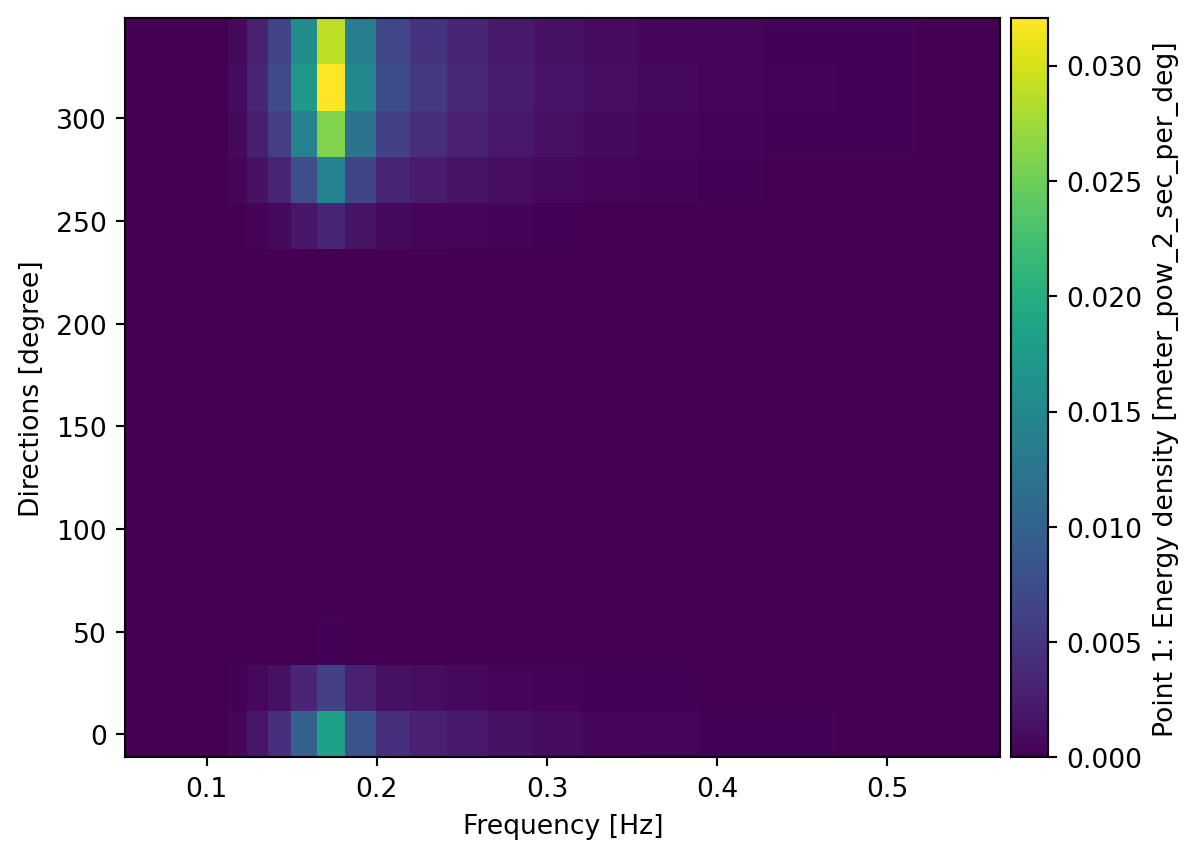
Logarithmic f-axis
fn = "../tests/testdata/pt_spectra.dfs2"
dfs = mikeio.open(fn, type="spectral")
da = dfs.read()[0]
da
<mikeio.DataArray>
name: Point 1: Energy density
dims: (time:31, y:16, x:25)
time: 2017-10-27 00:00:00 - 2017-10-27 05:00:00 (31 records)
geometry: Grid2D (ny=16, nx=25)da.geometry.is_spectralTrueda.geometry.x # logarithmic frequency axisarray([0.055 , 0.0605 , 0.06655 , 0.073205 , 0.08052551,
0.08857806, 0.09743587, 0.10717946, 0.1178974 , 0.12968715,
0.14265587, 0.15692146, 0.1726136 , 0.18987497, 0.20886247,
0.22974872, 0.2527236 , 0.27799597, 0.30579557, 0.33637513,
0.37001266, 0.40701393, 0.44771533, 0.49248688, 0.54173558])da.geometry<mikeio.Grid2D> (spectral)
x: [0.055, 0.0605, ..., 0.5417] (nx=25, dx=1.1)
y: [0, 22.5, ..., 337.5] (ny=16, dy=22.5)
projection: LONG/LATda.plot();