import mikeio
import matplotlib.pyplot as pltDfs2 - Slicing
ds = mikeio.read("../tests/testdata/waves.dfs2")
ds
<mikeio.Dataset>
dims: (time:3, y:31, x:31)
time: 2004-01-01 00:00:00 - 2004-01-03 00:00:00 (3 records)
geometry: Grid2D (ny=31, nx=31)
items:
0: Sign. Wave Height <Significant wave height> (meter)
1: Peak Wave Period <Wave period> (second)
2: Mean Wave Direction <Mean Wave Direction> (degree)ds[0].plot()
plt.axvline(x=1400,color='k',linestyle='dashed', label="Transect")
plt.legend();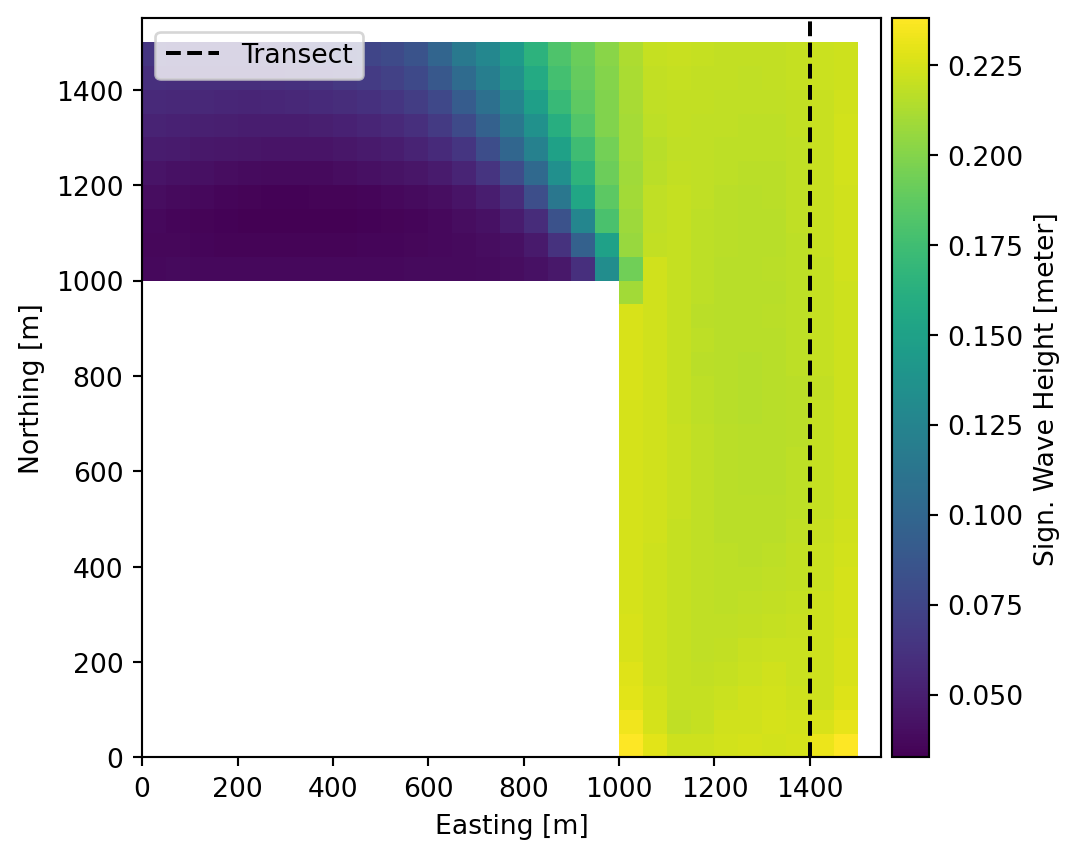
- Use
Dataset/DataArray.selwith physical coordinates.
ds.sel(x=1400)[0].plot()<AxesSubplot: xlabel='y', ylabel='time'>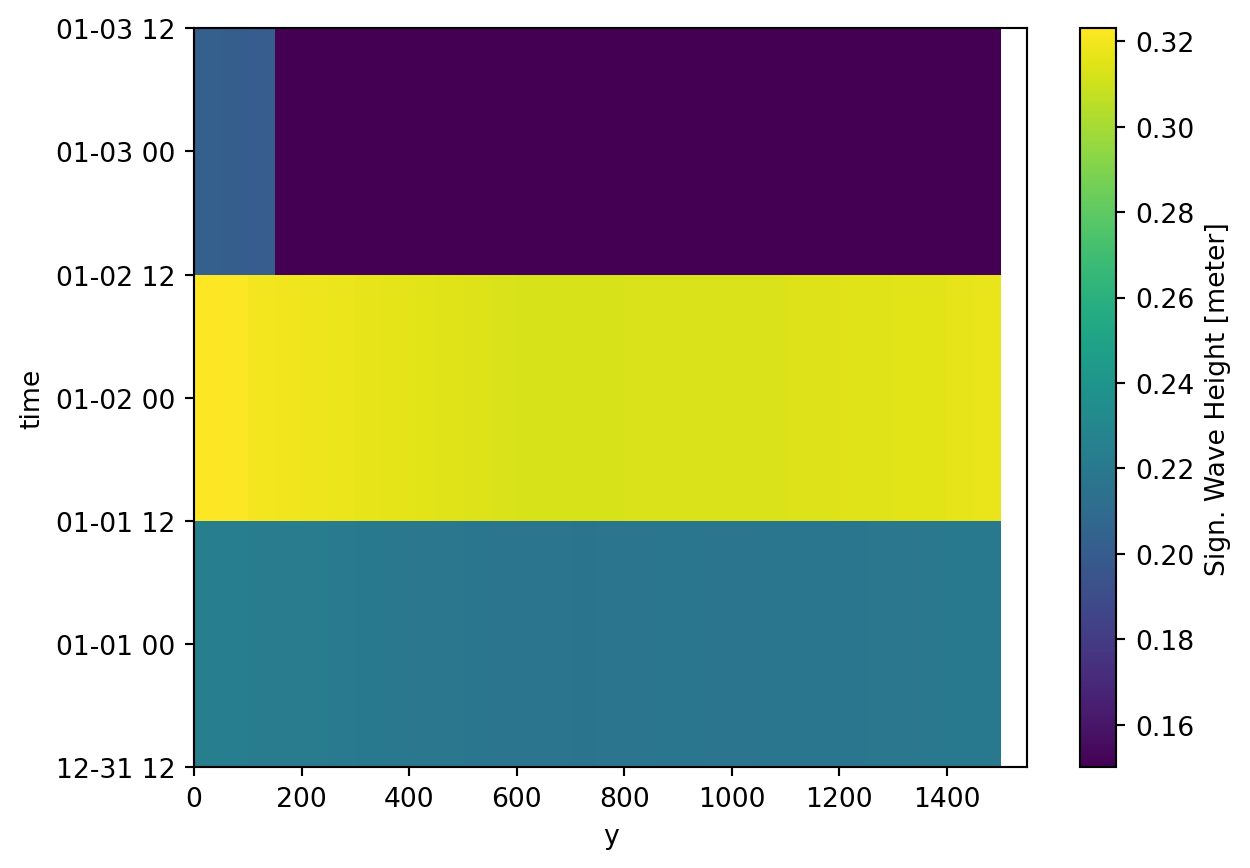
- Use grid coordinates with
Dataset/DataArray.isel
ds.geometry.find_index(x=1400)(array([27]), None)ds.isel(x=27)[0].plot()<AxesSubplot: xlabel='y', ylabel='time'>
ds.sel(x=1400).to_dfs("waves_x1400.dfs1")dsnew = mikeio.read("waves_x1400.dfs1")
dsnew<mikeio.Dataset>
dims: (time:3, x:31)
time: 2004-01-01 00:00:00 - 2004-01-03 00:00:00 (3 records)
geometry: Grid1D (n=31, dx=50)
items:
0: Sign. Wave Height <Significant wave height> (meter)
1: Peak Wave Period <Wave period> (second)
2: Mean Wave Direction <Mean Wave Direction> (degree)import os
os.remove("waves_x1400.dfs1")