import xarray
import mikeioBathymetric data
NetCDF
data import
GEBCO Compilation Group (2020) GEBCO 2020 Grid (doi:10.5285/a29c5465-b138-234d-e053-6c86abc040b9)
ds = xarray.open_dataset("../tests/testdata/gebco_2020_n56.3_s55.2_w12.2_e13.1.nc")
ds
<xarray.Dataset>
Dimensions: (lat: 264, lon: 216)
Coordinates:
* lat (lat) float64 55.2 55.21 55.21 55.21 ... 56.29 56.29 56.29 56.3
* lon (lon) float64 12.2 12.21 12.21 12.21 ... 13.09 13.09 13.09 13.1
Data variables:
elevation (lat, lon) int16 -8 -8 -8 -8 -9 -9 -9 -9 ... 72 71 72 77 80 80 86
Attributes:
Conventions: CF-1.6
title: The GEBCO_2020 Grid - a continuous terrain model for oceans...
institution: On behalf of the General Bathymetric Chart of the Oceans (G...
source: The GEBCO_2020 Grid is the latest global bathymetric produc...
history: Information on the development of the data set and the sour...
references: DOI: 10.5285/a29c5465-b138-234d-e053-6c86abc040b9
comment: The data in the GEBCO_2020 Grid should not be used for navi...
node_offset: 1.0ds.elevation.plot();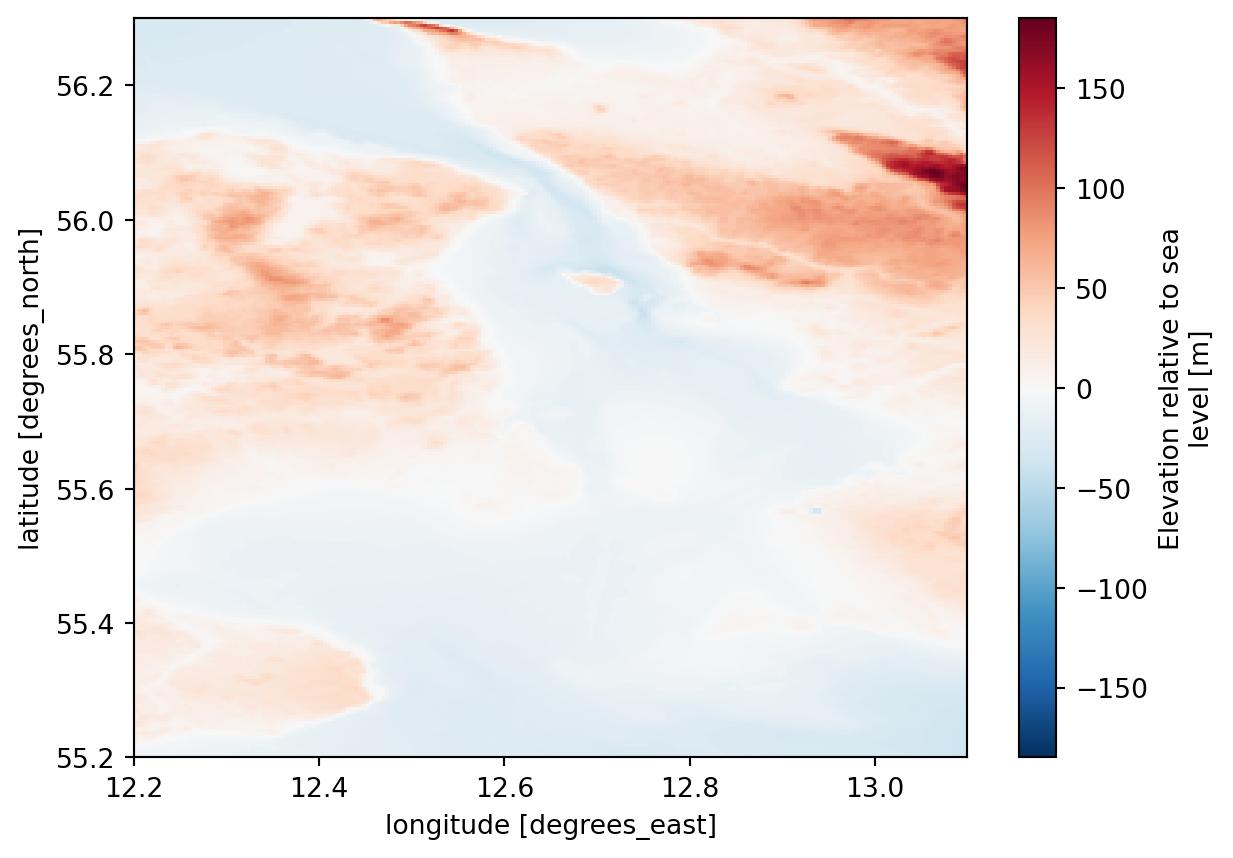
ds.elevation.sel(lon=12.74792, lat=55.865, method="nearest")<xarray.DataArray 'elevation' ()>
array(-43, dtype=int16)
Coordinates:
lat float64 55.86
lon float64 12.75
Attributes:
standard_name: height_above_reference_ellipsoid
long_name: Elevation relative to sea level
units: m
sdn_parameter_urn: SDN:P01::BATHHGHT
sdn_parameter_name: Sea floor height (above mean sea level) {bathymetric...
sdn_uom_urn: SDN:P06::ULAA
sdn_uom_name: MetresCheck ordering of dimensions, should be (y,x)
ds.elevation.dims('lat', 'lon')el = ds.elevation.values
el.shape(264, 216)Check that axes are increasing, S->N W->E
ds.lat.values[0],ds.lat.values[-1] (55.20208333333332, 56.29791666666665)ds.lat.values[0] < ds.lat.values[-1] Trueds.lon.values[0],ds.lon.values[-1] (12.20208333333332, 13.097916666666663)el[0,0] # Bottom left-8el[-1,0] # Top Left-31geometry = mikeio.Grid2D(x=ds.lon.values, y=ds.lat.values, projection="LONG/LAT")
geometry<mikeio.Grid2D>
x: [12.2, 12.21, ..., 13.1] (nx=216, dx=0.004167)
y: [55.2, 55.21, ..., 56.3] (ny=264, dy=0.004167)
projection: LONG/LATda = mikeio.DataArray(data=el,
item=mikeio.ItemInfo("Elevation", mikeio.EUMType.Total_Water_Depth),
geometry=geometry,
dims=("y","x") # No time dimension
)
da<mikeio.DataArray>
name: Elevation
dims: (y:264, x:216)
time: 2018-01-01 00:00:00 (time-invariant)
geometry: Grid2D (ny=264, nx=216)da.plot();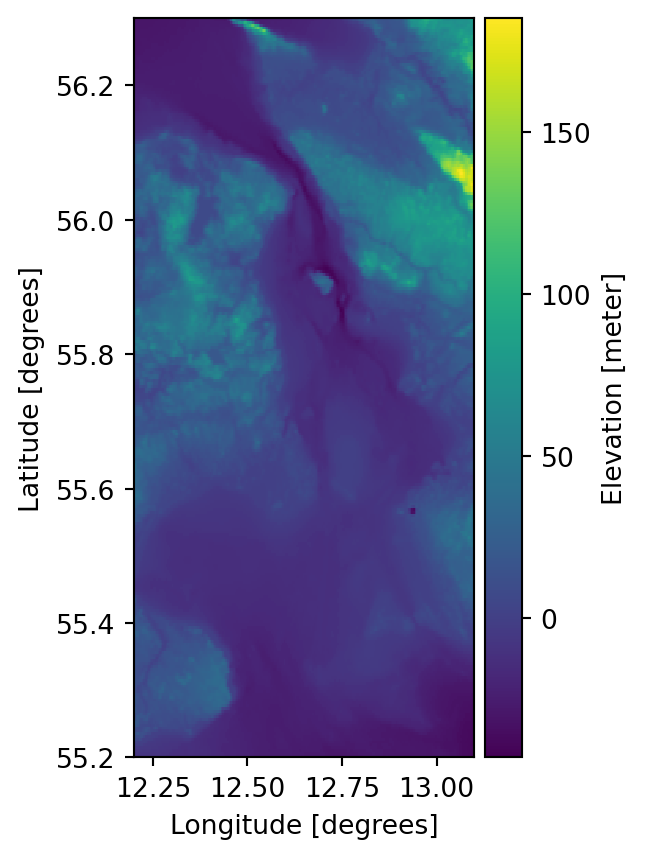
da.plot(cmap='coolwarm', vmin=-100, vmax=100);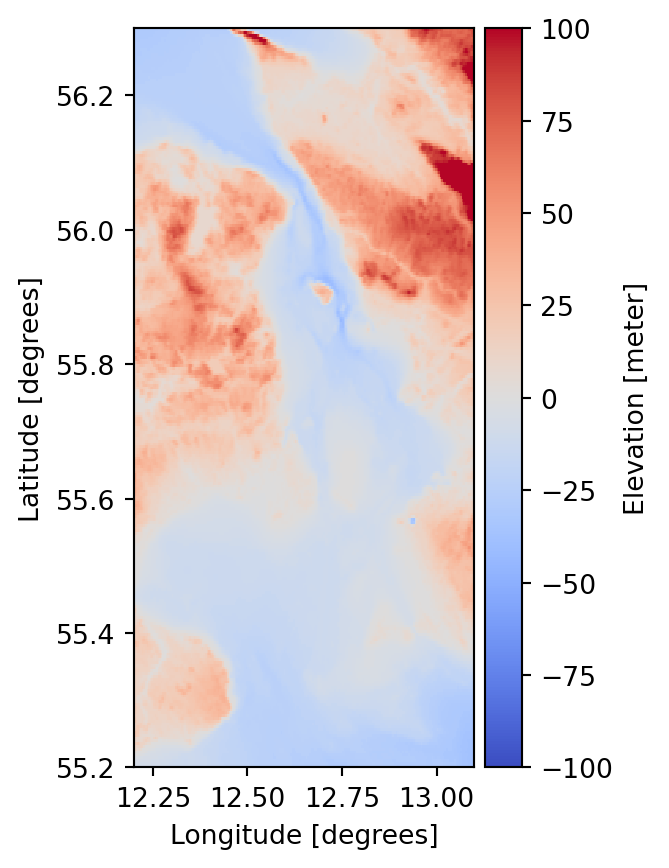
da.to_dfs("gebco.dfs2")ds = mikeio.read("gebco.dfs2")
ds.Elevation.plot()<AxesSubplot: xlabel='Longitude [degrees]', ylabel='Latitude [degrees]'>
Clean up
import os
os.remove("gebco.dfs2")