import numpy as np
import matplotlib.pyplot as plt
import mikeioDataArray - Masking
Similar to numpy arrays, DataArrays can be filtered based on values (e.g. all values above a threshold), which will return a DataArray with boolean values.
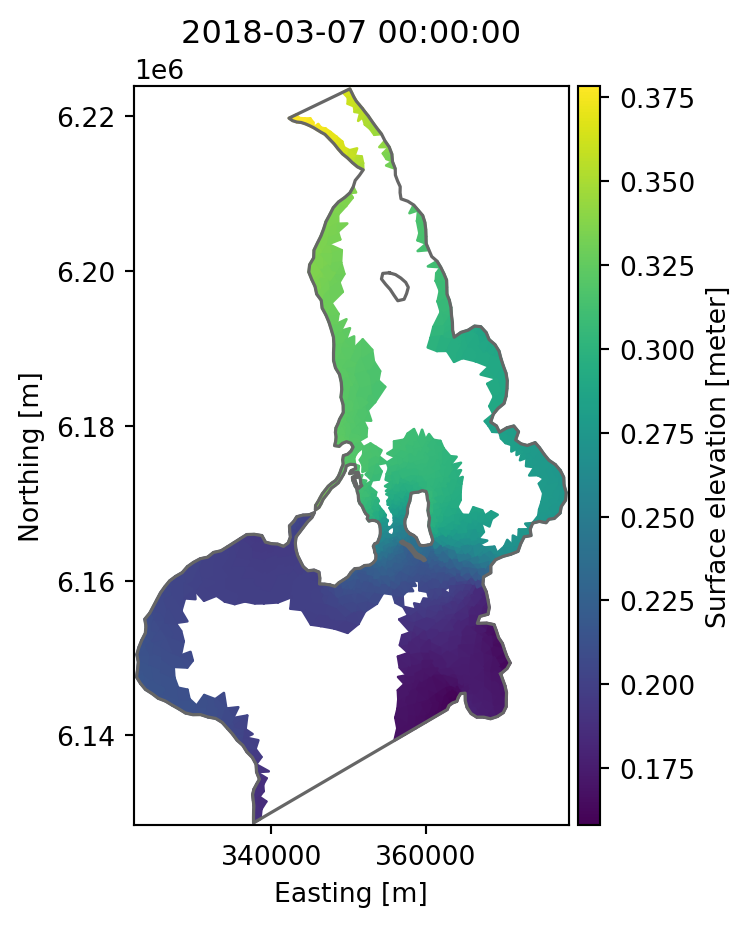
Surface elevation in Oresund
Read 3 timesteps of Surface elevation from dfsu2d file.
fn = "../tests/testdata/oresundHD_run1.dfsu"
da = mikeio.read(fn, items="Surface elevation", time=[0,2,4])[0]
da
<mikeio.DataArray>
name: Surface elevation
dims: (time:3, element:3612)
time: 2018-03-07 00:00:00 - 2018-03-11 00:00:00 (3 records)
geometry: Dfsu2D (3612 elements, 2046 nodes)_, ax = plt.subplots(1, da.n_timesteps, figsize=(11,5), sharey=True)
for step in range(da.n_timesteps):
da[step].plot(ax=ax[step], vmin=0.08, vmax=0.35)
Mask values below 0.2m
Assume that we are not interested in values below 0.2m. Let us find those and call the DataArray mask.
threshold = 0.2
mask = da<threshold
mask
<mikeio.DataArray>
name: Boolean
dims: (time:3, element:3612)
time: 2018-03-07 00:00:00 - 2018-03-11 00:00:00 (3 records)
geometry: Dfsu2D (3612 elements, 2046 nodes)Now let’s set define a new DataArray wl_capped for which we set all values below the threshold to NaN.
wl_capped = da.copy()
wl_capped[mask] = np.nan
wl_capped
<mikeio.DataArray>
name: Surface elevation
dims: (time:3, element:3612)
time: 2018-03-07 00:00:00 - 2018-03-11 00:00:00 (3 records)
geometry: Dfsu2D (3612 elements, 2046 nodes)Now let’s plot both the boolean mask and the new capped DataArray for each of the three timesteps
_, ax = plt.subplots(2, da.n_timesteps, figsize=(11,10), sharey=True)
for step in range(da.n_timesteps):
    mask[step].plot(ax=ax[0,step], cmap="Reds", add_colorbar=False)
    wl_capped[step].plot(ax=ax[1,step], vmin=0.08, vmax=0.35)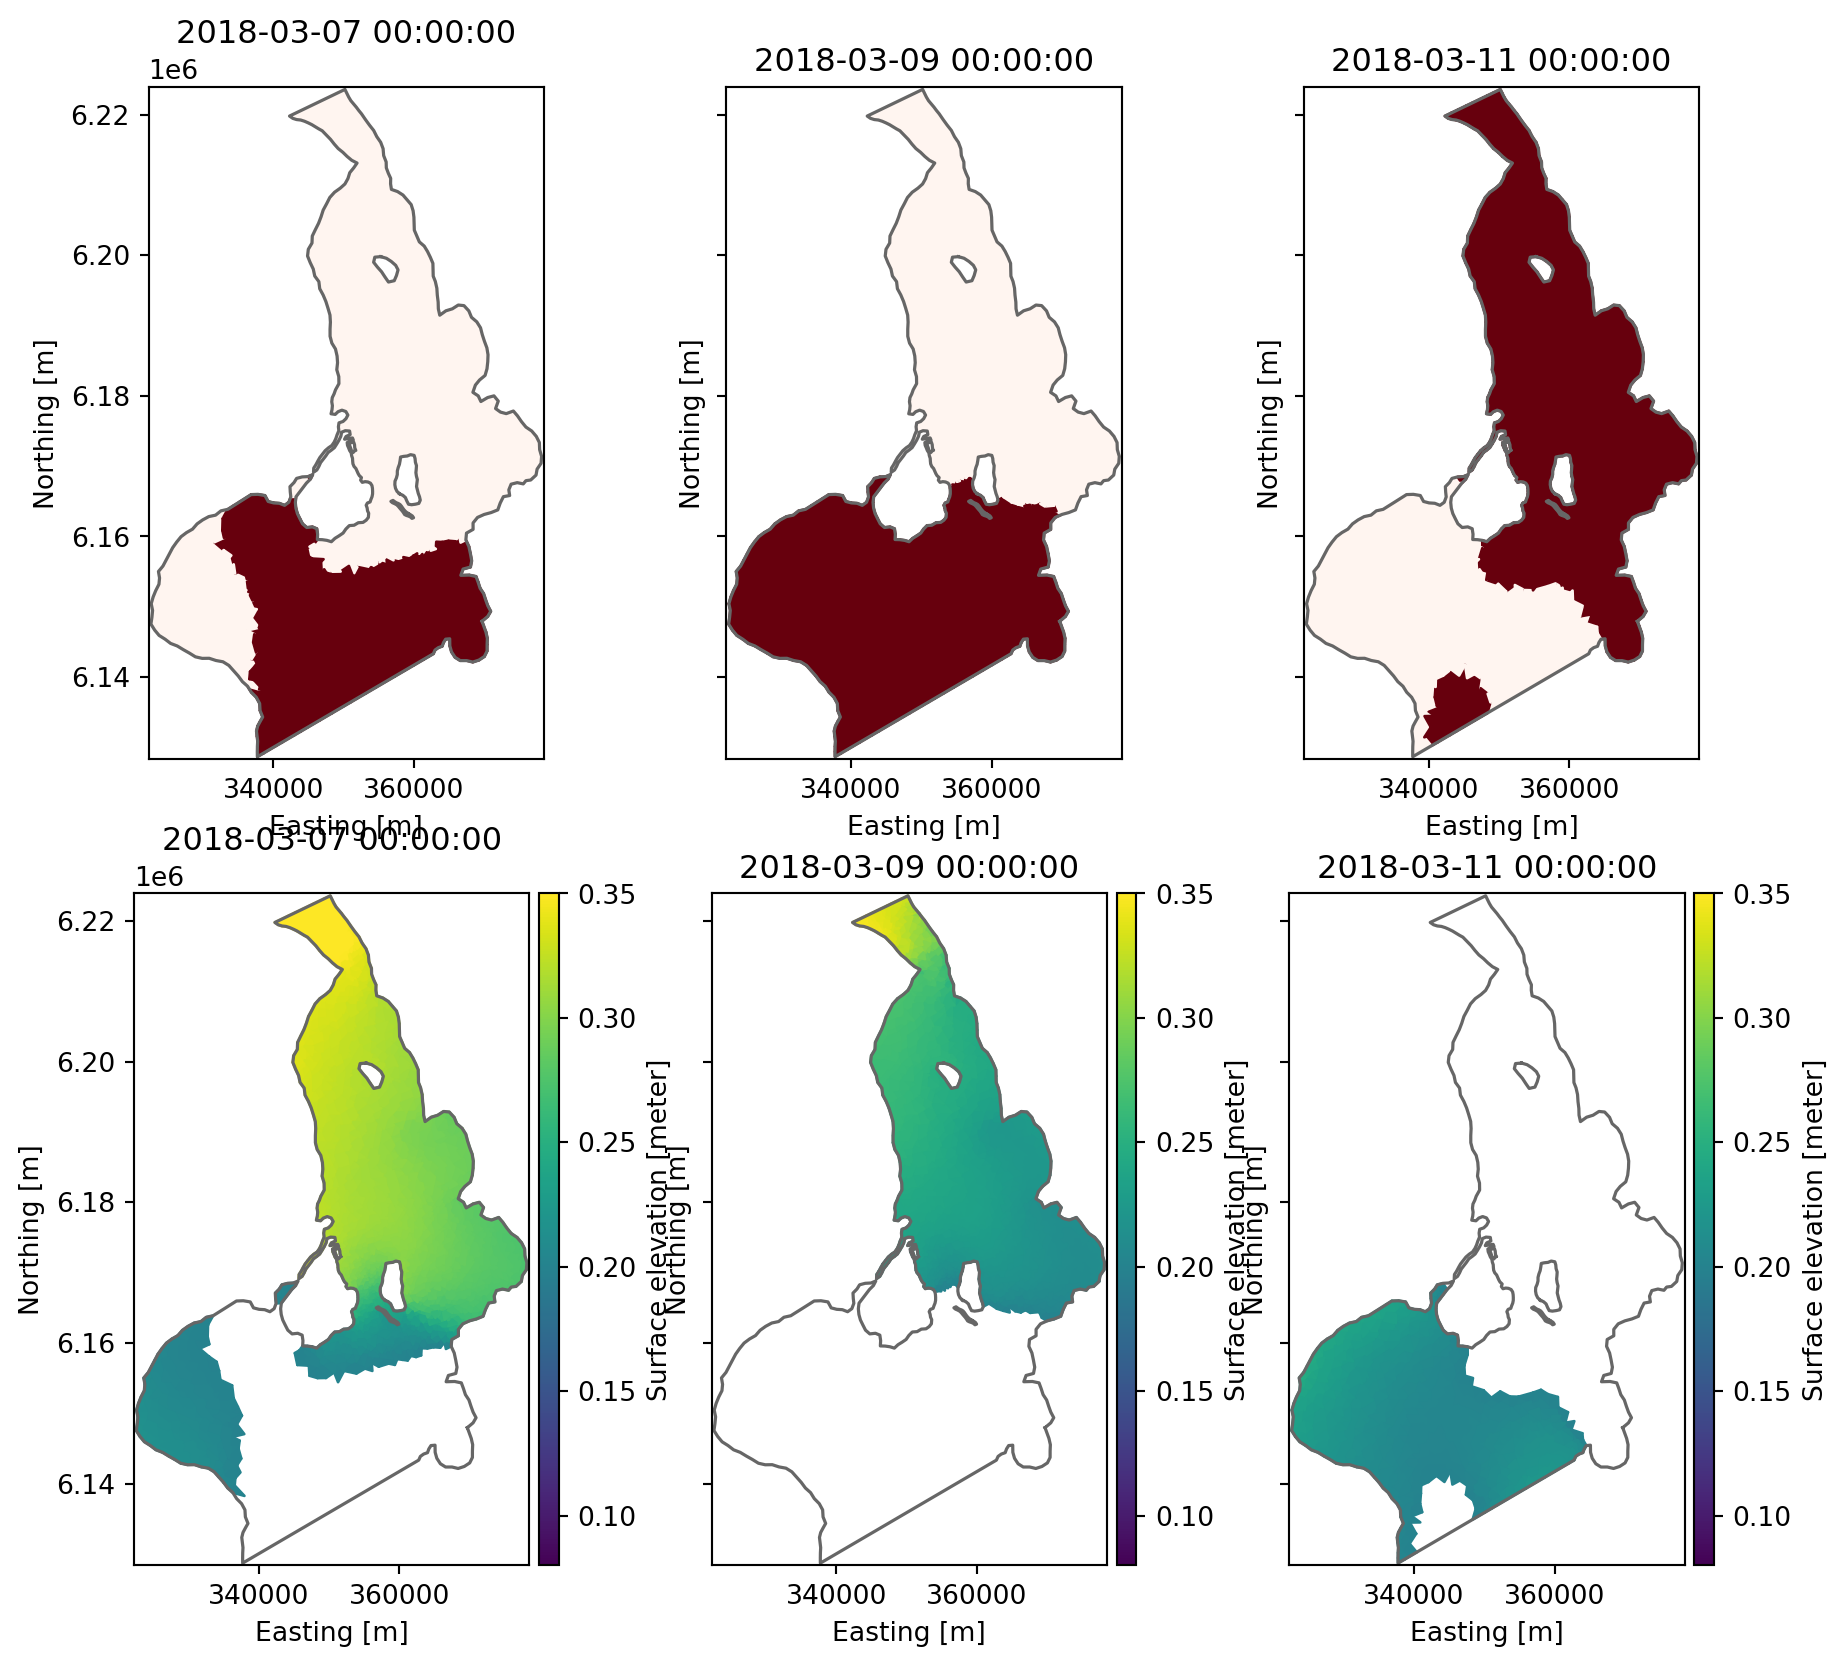
Boolean indexing with numpy array
The boolean indexing can also be done with a plain numpy array (it does not need to be a mikeio.DataArray).
In this example, we set all elements with depth lower than -10m to NaN.
ze = da.geometry.element_coordinates[:,2]
ze.shape(3612,)wl_shallow = da.copy()
wl_shallow[ze<-10] = np.nan # select all elements with depth lower than -10m
wl_shallow.shape(3, 3612)wl_shallow.plot();