import matplotlib.pyplot as plt
import mikeioDataArray - Dfsu plotting
A DataArray with flexible mesh data, can be plotted in many different ways.
Dfsu 2d
fn = "../tests/testdata/oresundHD_run1.dfsu"
ds = mikeio.read(fn)
ds
<mikeio.Dataset>
dims: (time:5, element:3612)
time: 2018-03-07 00:00:00 - 2018-03-11 00:00:00 (5 records)
geometry: Dfsu2D (3612 elements, 2046 nodes)
items:
0: Surface elevation <Surface Elevation> (meter)
1: Total water depth <Water Depth> (meter)
2: U velocity <u velocity component> (meter per sec)
3: V velocity <v velocity component> (meter per sec)da = ds["Surface elevation"]
da<mikeio.DataArray>
name: Surface elevation
dims: (time:5, element:3612)
time: 2018-03-07 00:00:00 - 2018-03-11 00:00:00 (5 records)
geometry: Dfsu2D (3612 elements, 2046 nodes)Plot as map
# default plot is a map, for multiple timestep data, the first timestep will be shown
da.plot();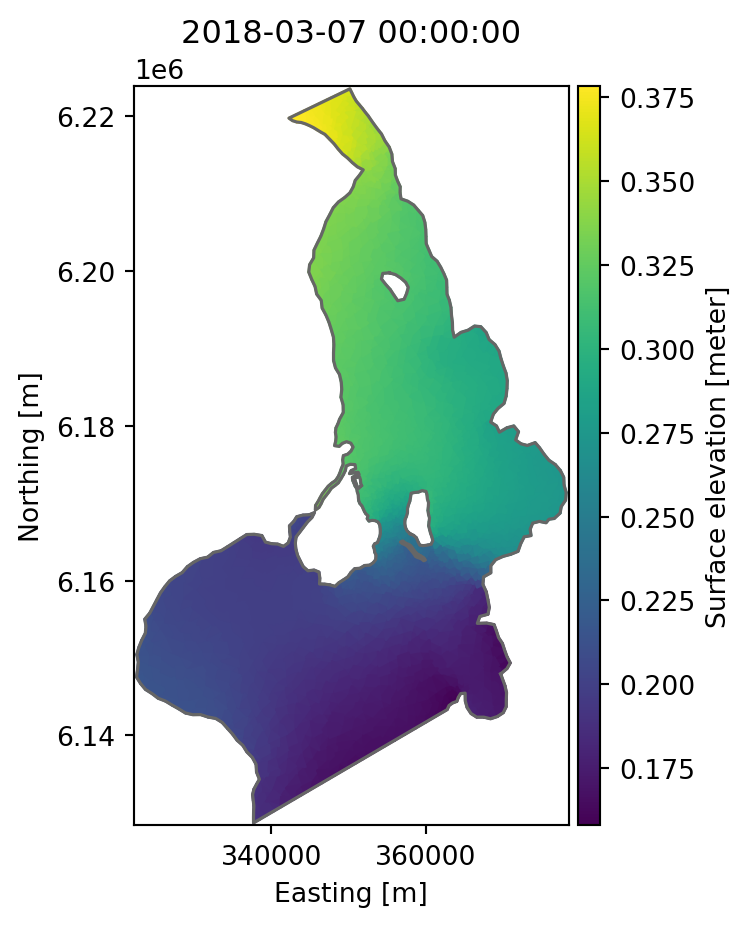
# plot last time step as contour map
da[-1].plot.contour(figsize=(5,8));
_, ax = plt.subplots(1,2)
da.plot.mesh(ax=ax[0]);
da.plot.outline(ax=ax[1]);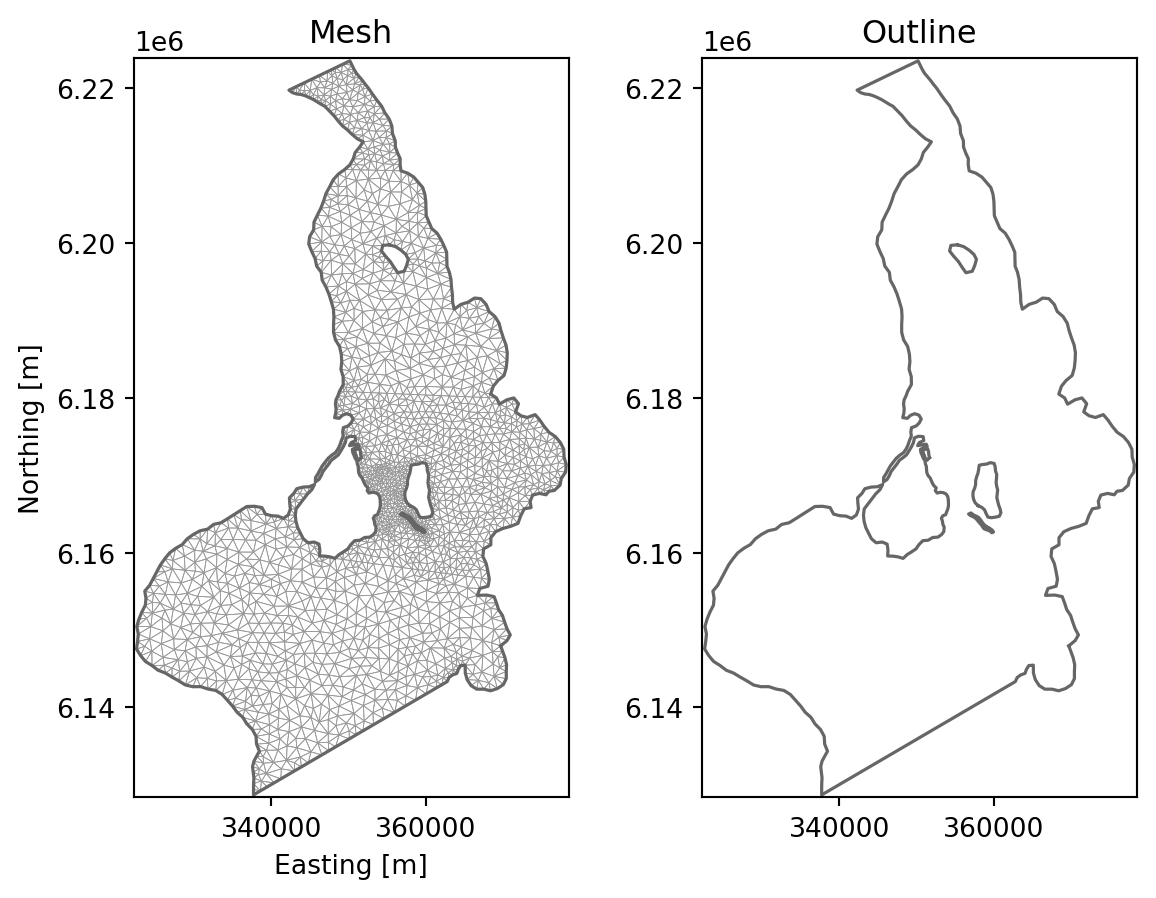
Plot aggregated data
da.max().plot(title="Max");
# difference between last and first timestep
(da[0] - da[-1]).plot.contourf(title="Difference");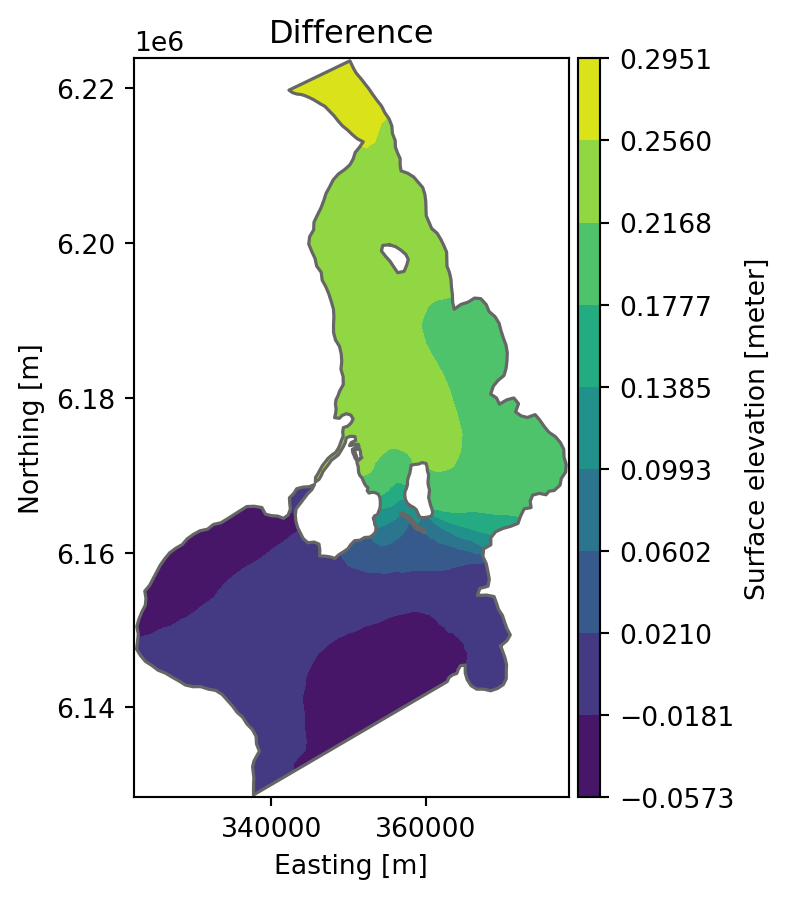
da.mean(axis="space").plot(title="Spatial mean as function of time");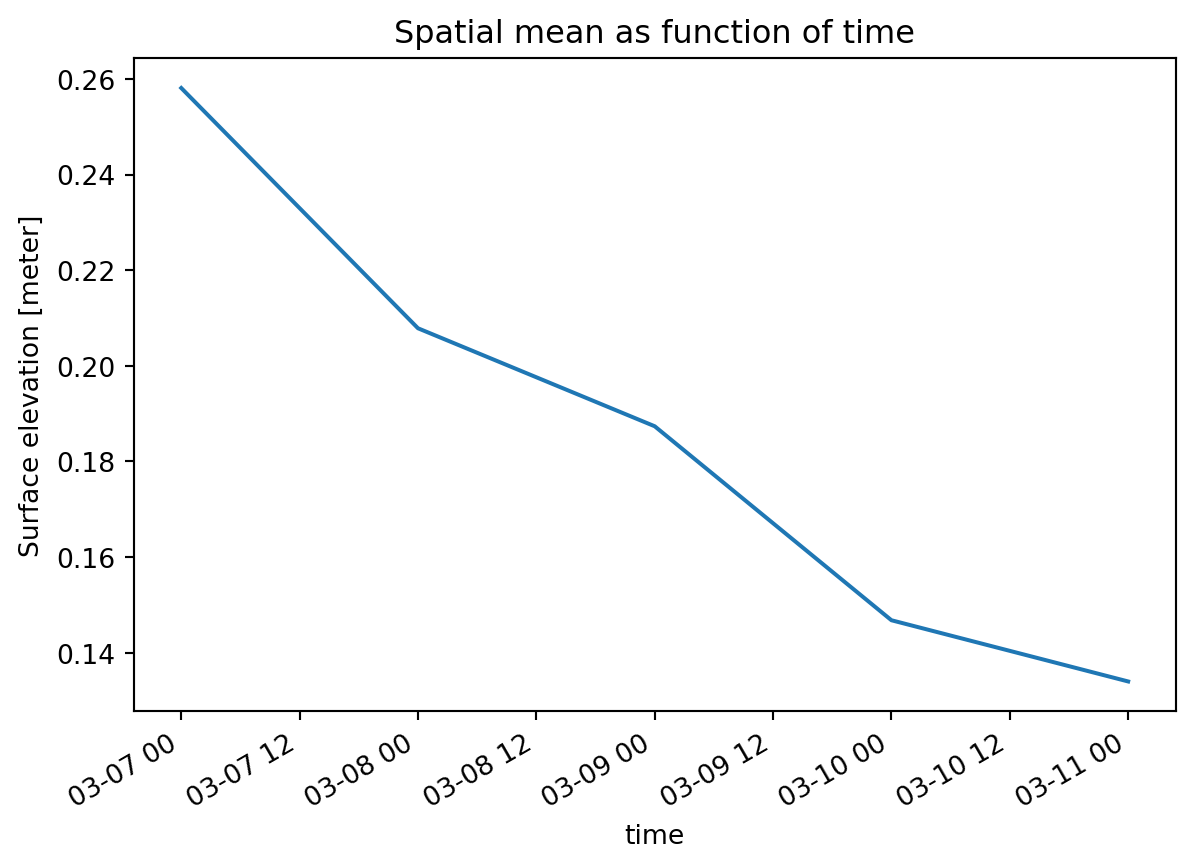
Other plots
- time series
- histogram
# plot all data as histogram
da.plot.hist(bins=100);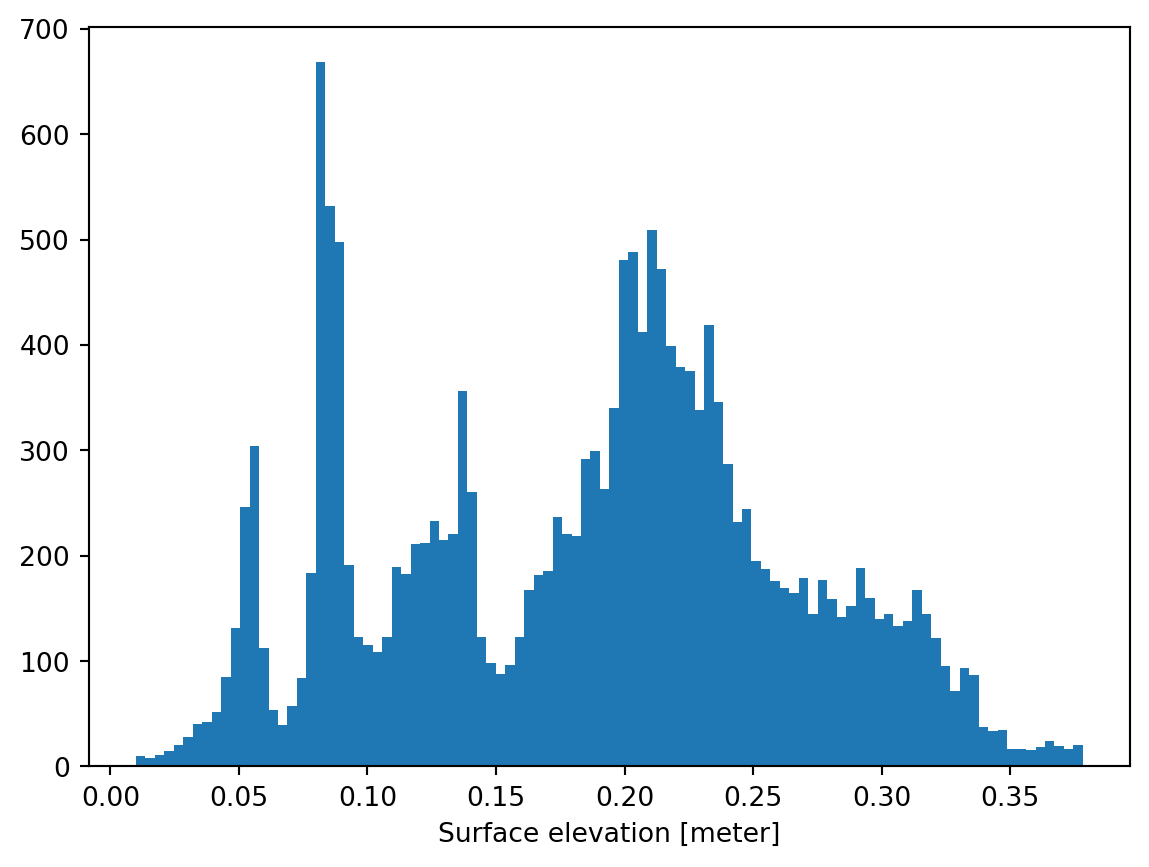
# plot all points as timeseries
da.plot.line(alpha=0.01);
Dfsu 3d
fn = "../tests/testdata/oresund_sigma_z.dfsu"
dfs = mikeio.open(fn)
dfs
Dfsu3DSigmaZ
number of elements: 17118
number of nodes: 12042
projection: UTM-33
number of sigma layers: 4
max number of z layers: 5
items:
0: Temperature <Temperature> (degree Celsius)
1: Salinity <Salinity> (PSU)
time: 3 steps with dt=10800.0s
1997-09-15 21:00:00 -- 1997-09-16 03:00:00Read a specific layer
If only a specific layer is read, then all the standard 2d plotting can be used
ds = dfs.read(layers="top")
ds
<mikeio.Dataset>
dims: (time:3, element:3700)
time: 1997-09-15 21:00:00 - 1997-09-16 03:00:00 (3 records)
geometry: Dfsu2D (3700 elements, 2090 nodes)
items:
0: Temperature <Temperature> (degree Celsius)
1: Salinity <Salinity> (PSU)ds.geometry.is_2dTrueds[1].plot(); 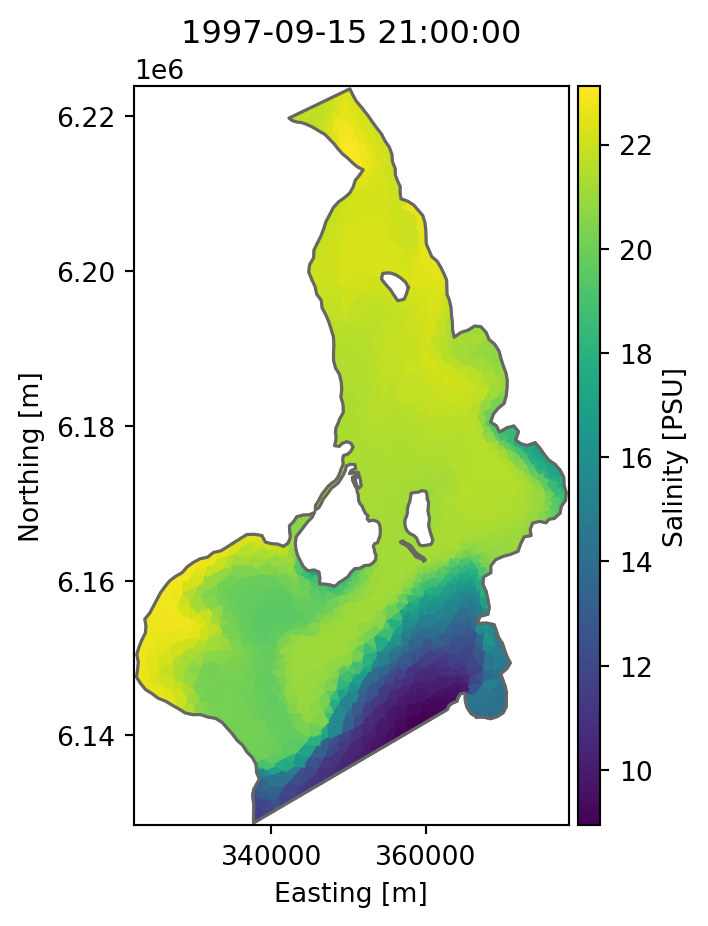
Default plotting behaviour for 3d files is to plot surface layer
ds = dfs.read()
ds
<mikeio.Dataset>
dims: (time:3, element:17118)
time: 1997-09-15 21:00:00 - 1997-09-16 03:00:00 (3 records)
geometry: Dfsu3DSigmaZ (17118 elements, 4 sigma-layers, 5 z-layers)
items:
0: Temperature <Temperature> (degree Celsius)
1: Salinity <Salinity> (PSU)ds.geometry.is_2dFalseds[1].plot();